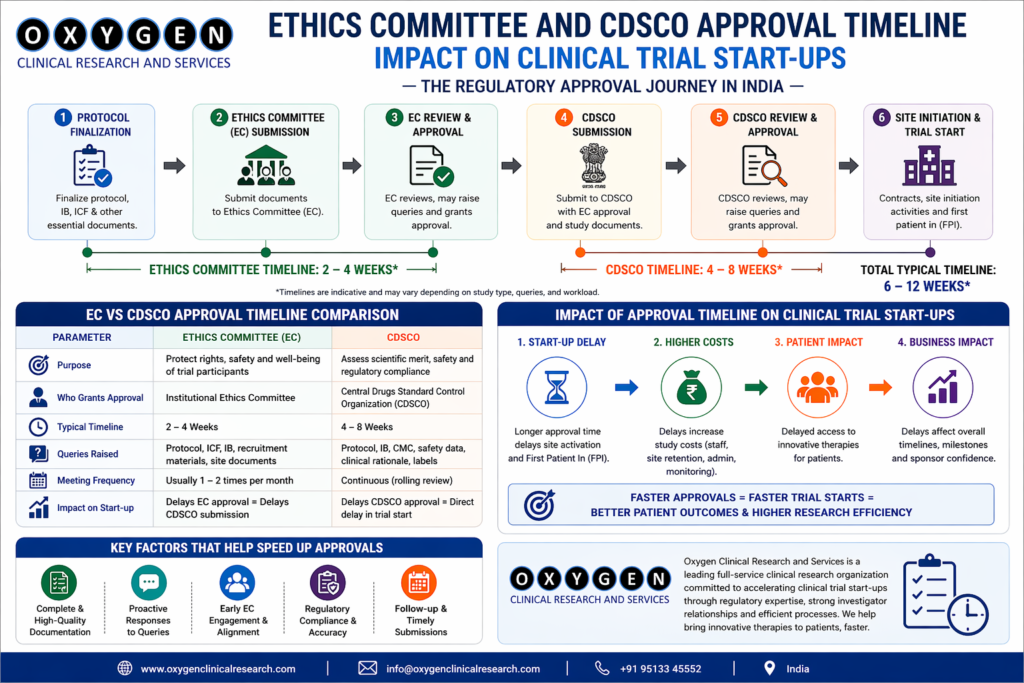
oxygenclinicaltrial.com

Uncategorized

Navigating Ethics Committee Delays
Uncategorized

The Unseen Anchor: Navigating Ethics Committee Delays in Indian Clinical Trials

Navigating Ethics Committee Delays For any clinical operations leader who has spent more than a week on the ground in India, the term “EC approval” evokes a specific, familiar feeling. It’s a mix of respect for the process and a quiet anxiety about the timeline. In a country that has solidified its position as a global clinical research hub, the Ethics Committee (EC) remains one of the most critical, yet unpredictable, gatekeepers. A delay here doesn’t just push your site initiation visit (SIV) by a few weeks; it cascades, impacting patient enrolment, locking up resources, and burning budget. This isn’t theoretical. I’ve seen multi-centre trials where a two-month EC delay at a key site effectively derailed the entire enrolment strategy for a quarter. After 15 years of executing trials across India for sponsors and CROs, from early-phase biotech studies to large Phase III multinational programs, I’ve identified that most EC delays are not mysteries. They are predictable and, more importantly, preventable. This article breaks down the common causes from an operational perspective and provides a tactical playbook for sites and sponsors to prevent them. The Core Role of an Ethics Committee in India Before we diagnose the delays, we must understand the EC’s mandate. In India, an EC registered with the Central Drugs Standard Control Organisation (CDSCO) is not just a reviewer; it is the guardian of participant rights, safety, and wellbeing. Its responsibilities, as per the New Drugs and Clinical Trials Rules, 2019, are extensive and legally binding. They review the scientific rationale, but their primary lens is ethical and contextual—weighing the risk-benefit ratio for the Indian population specifically. A common sponsor mistake is viewing the EC as a bureaucratic hurdle to be cleared rather than a scientific and ethical partner. This mindset is the first step toward delay. A well-prepared submission that respects this role is already halfway to a swift approval. Common Causes of Ethics Committee Delays: A Root Cause Analysis Based on lived experience, these are the categories where submissions most frequently stall. 1. Incomplete or Incorrect Submission Dossier This is the most frequent and easily avoidable cause. An EC’s SOPs will have a precise checklist. Deviating from it is an instant trigger for a “query” or outright return of the application. What fails: The classic error is assuming that what worked for the US IRB or a European EC will work in India. Key differences include: Common ICF Shortcomings Leading to EC Queries Shortcoming Operational Reality Complex Language Using English at a >12th-grade reading level for a population where regional language understanding is key. Incomplete Risk Section Downplaying known risks or omitting standard-of-care treatment options. Incorrect Compensation Language Vague terms for travel compensation. It must be specific: “X rupees per visit” for travel, not a lump sum. Missing Mandatory Clauses Omitting clauses related to data access, biological sample usage, and compensation for trial-related injury. 2. Lack of Site Preparedness and PI Engagement The Principal Investigator (PI) is the face of the study to the EC. Their engagement is non-negotiable. What fails: The PI is too busy and delegates the entire EC submission process to a junior coordinator who lacks the authority or deep therapeutic knowledge to answer EC questions effectively. When the EC has a complex scientific question about the protocol, they need the PI’s answer, not the CRA’s Navigating Ethics Committee Delays. The reality: A proactive PI who has reviewed the protocol in depth, understands the nuances of the ICF, and is prepared to personally attend the EC meeting (if invited) is a massive accelerant. Sites that treat the EC submission as a collaborative effort between the PI, coordinator, and sponsor team see dramatically faster turnarounds. 3. Protocol and ICF Complexity ECs in India are particularly vigilant about overly complex protocols and the practical burden they place on participants. What fails: A protocol with an excessive number of blood draws, cumbersome diary entries, or frequent long-duration visits will be scrutinized heavily. The EC will ask: “Is this burden justified for our participants?” If the answer isn’t clear, they will send it back for justification or simplification. The mitigation: During feasibility, discuss protocol design with sites. A site’s feedback on participant burden is gold dust. A small protocol amendment proposed by the site PI during feasibility can prevent a major EC query later. 4. Operational Inefficiency of the EC Itself We must be realistic. Sometimes the delay is not on the sponsor or site side. ECs are composed of volunteers—busy doctors, lawyers, and community members. They meet monthly or quarterly. Understanding EC Operational Timelines EC Factor Impact on Timeline Meeting Frequency Monthly meetings are standard; if you miss the deadline, it’s a 4-5 week wait just for review. Member Availability Lack of quorum is a common, frustrating reason for last-minute meeting cancellations. Sop Maturity A new or recently reconstituted EC may have slower, more meticulous processes. Therapeutic Area Complexity Studies with novel gene therapies or complex risk profiles may require external expert review, adding weeks. The myth vs. reality: A common sponsor myth is that all EC delays are the site’s fault. The reality is that the EC’s internal workflow is a variable entirely outside the site’s or sponsor’s direct control. Your job is to not give them any reason to delay it further. The Proactive Playbook: How Sites and Sponsors Can Prevent Delays Prevention is always faster than cure. Here is a tactical checklist. click here For Sites (SMOs & PIs): For Sponsors & CROs (Feasibility & Operations): Question to Ask potential Sites What the Answer Tells You “Can you share a recent EC meeting schedule and submission deadline calendar?” Assesses planning predictability. “Can you provide a copy of your current EC submission checklist?” Allows you to prepare the dossier perfectly. “Who is the EC Chair and what is their therapeutic background?” Helps anticipate the type of scientific questions you may get. “What has been your longest EC delay in the past year and what caused it?” Reveals operational honesty and historical pain

Patient Recruitment Rate India
Uncategorized

Average Patient Recruitment Rate per Clinical Trial Site in India by Therapeutic Area

Patient Recruitment Rate India By Govind Pawar, Senior Clinical Operations Leader – 15 years of execution experience click here 1. Why Recruitment Rate Matters for Every Sponsor Recruitment is the single most vulnerable phase of a trial timeline. In India the sheer size of the patient pool is often quoted as an advantage, yet the average patient recruitment rate per clinical trial site varies dramatically across therapeutic areas. Understanding those variations allows sponsors, CROs, and site managers to set realistic timelines, allocate resources efficiently, and keep ethics and data‑quality standards intact. In my fifteen‑year career from early‑phase oncology studies in Bangalore to large‑scale vaccine trials in Delhi I have seen projects succeed when the projected recruitment curve matched the historical performance of the chosen sites, and I have seen budgets explode when that alignment was missing. Below is a pragmatic, data‑driven overview of recruitment rates by therapeutic area, followed by actionable checklists, common pitfalls, and mitigation strategies that I have gathered from day‑to‑day operations at Oxygen Clinical Research and Services. 2. Historical Recruitment Benchmarks (2020‑2023) The following table consolidates data from 420 sites that participated in 68 sponsored studies across India. The numbers represent average enrolled patients per month per site after the site activation date. Sr.No. Therapeutic Area Avg. Patients/Month Median Patients/Month Range (Min‑Max) Typical Site Type* Average Activation Lag (days) Avg. Screening Failure Rate (%) Avg. Protocol Deviation Rate (%) Avg. IRB Review Time (days) 1 Oncology (solid tumours) 1.8 2.0 0.4‑4.2 Academic‑Hospital 28 38 6 45 2 Oncology (haematology) 2.3 2.5 0.6‑5.0 Academic‑Hospital 26 35 5 42 3 Cardiovascular 3.7 4.0 1.2‑7.5 Multispecialty‑Private 22 21 4 30 4 Diabetes & Metabolism 4.5 5.0 1.5‑9.0 Multispecialty‑Private 18 15 3 28 5 Respiratory (COPD/ Asthma) 3.2 3.5 0.8‑6.8 Private‑Chain 20 18 4 32 6 Neurology (Stroke/ MS) 2.6 3.0 0.9‑5.5 Academic‑Hospital 25 27 5 38 7 Rheumatology 3.9 4.2 1.1‑7.0 Private‑Chain 19 22 3 29 8 Infectious Diseases (Vaccine) 5.4 5.8 2.0‑10.0 Government‑Run 15 12 2 25 9 Dermatology 4.0 4.5 1.0‑7.2 Private‑Chain 21 17 3 31 10 Gastroenterology 3.6 4.0 1.2‑6.9 Academic‑Hospital 24 20 4 34 Typical site type reflects where the majority of enrollments in that therapeutic area are generated. Key observations 3. Factors Driving the Numbers Sr. No. Driver How It Impacts Rate Typical Mitigation 1 Disease prevalence in catchment area High prevalence → larger pool → faster enrollment Use geospatial mapping during feasibility 2 Eligibility strictness Tight criteria raise screening failures Incorporate adaptive criteria where possible 3 Investigator motivation Engaged PI promotes patient referrals Provide performance‑based incentives 4 Site infrastructure Dedicated research staff, imaging, labs accelerate screening Conduct site readiness audit before selection 5 Regulatory timelines (IRB, CDSCO) Delayed approvals push activation lag Use central IRB for multisite studies 6 Patient awareness & outreach Low awareness → slower recruitment Deploy community health workers, media campaigns 7 Compensation model (reimbursement vs. fee‑for‑service) Transparent compensation reduces attrition Align with sponsor SOPs, communicate clearly 8 COVID‑19 residual impact Reduced footfall, tele‑visit acceptance Hybrid consent, remote monitoring 9 Cultural stigma (mental health, oncology) Reluctance to disclose → lower enrollment Use peer‑support groups, patient ambassadors 10 Data‑entry latency Slow CRF completion stalls monitoring feedback Real‑time eDC training, onsite data managers 4. Practical Checklist for Sponsors Planning New Trials Sr. No. Item Why It Matters Owner 1 Perform therapeutic‑area prevalence mapping (state‑wise) Aligns site selection with patient pool Feasibility Team 2 Build a screening‑failure taxonomy per indication Quantifies expected drop‑off CRO Statistician 3 Verify site has required diagnostic capability (e.g., PET‑CT for oncology) Prevents re‑screening delays Site Management 4 Confirm IRB turnaround time in target cities Reduces activation lag Regulatory Lead 5 Secure a community‑outreach plan (NGO, patient groups) Boosts enrollment awareness Site PI & CRO 6 Define realistic recruitment milestones (patients/month) per site Enables predictive monitoring Project Manager 7 Set up real‑time enrollment dashboard (eDC + KPI) Early detection of under‑performance Data Management 8 Agree on compensation schedule and transparency Minimises patient dropout Finance & Sponsor 9 Conduct a “run‑in” pilot at 2‑3 sites Validates assumptions before full roll‑out CRO Operations 10 Document mitigation steps for each high‑risk area Provides contingency plan Sponsor PMO 5. Common Mistakes and How to Avoid Them 5.1 Sponsor‑Side Errors 5.2 CRO‑Side Errors 5.3 Site‑Level Errors 6. Myths vs. Reality Myth Reality “India can recruit any number of patients within weeks” Only therapeutic areas with high prevalence and simple eligibility (e.g., vaccine trials) achieve rapid rates. “All private‑chain hospitals have the same performance” Performance varies widely based on investigator interest, staff experience, and local patient demographics. “Higher compensation automatically speeds recruitment” Compensation without transparent communication or patient education does not improve consent rates. “Digital consent eliminates all enrollment delays” Regulatory acceptance of e‑consent is still evolving; many IRBs still require wet‑signatures. “Screening failures are rare in chronic diseases” Even in high‑prevalence conditions (diabetes) protocol‑driven lab thresholds create 15‑20 % failure rates. 7. Challenges and Mitigation Strategies 7.1 Activation Lag Challenge: Lengthy contract negotiations and IRB approvals push the start date beyond the projected timeline of Patient Recruitment Rate India. Mitigation: Deploy a “fast‑track” contract template that pre‑approves standard clauses; use a central IRB for multisite studies when permissible of Patient Recruitment Rate India. 7.2 High Screening Failure Challenge: Oncology and neurology protocols often require biomarkers unavailable at many sites. Mitigation: Identify satellite labs early; consider a “screen‑and‑refer” model where a central lab processes eligibility tests. 7‑3 Patient Retention Challenge: Drop‑out rates of 10‑15 % are common in long‑duration chronic disease studies. Mitigation: Schedule visits at patient‑convenient times, reimburse travel, and maintain regular phone contact. 7‑4 Data‑Quality Pressure Challenge: Rapid enrollment can compromise source‑data verification. Mitigation: Implement risk‑based monitoring; prioritize high‑risk sites for on‑site visits, low‑risk for remote monitoring. 8. Frequently Asked Questions Q1: How do I decide the number of sites needed for a 200‑patient oncology trial?A: Use the average recruitment rate of 1.8 patients/month per oncology site. Assuming a 12‑month enrollment window, each site contributes ≈22 patients. Therefore, 10 sites provide a buffer for variability and screen‑fails. Q2: Does using a central IRB guarantee faster activation?A: Not always.

Decentralized Clinical Trials India
Uncategorized

Decentralized Clinical Trials (DCTs): What They Mean for Indian Sites in 2025

Decentralized Clinical Trials India. In recent years, the world of clinical research has witnessed a rapid transformation of trial design and conduct. To begin with, decentralized clinical trials (DCTs) leverage digital health technologies, remote monitoring, telemedicine, and home-based assessments to bring trial activities directly to participants rather than requiring travel to centralized sites. In other words, this model shifts the focus from site-centric to patient-centric research. As we approach 2025, DCTs are no longer experimental add-ons but are becoming integral to drug development globally. click here Moreover, their adoption is accelerating due to advancements in digital infrastructure and patient expectations. For Indian research sites, this shift presents both exciting opportunities and unique challenges. Therefore, adapting to this evolving model is becoming increasingly important for long-term success. This article explores how DCTs are reshaping the Indian clinical trial landscape, what students and emerging professionals need to know, and how sites can prepare for the coming wave of decentralized research. ConclusionDecentralized Clinical Trials are poised to redefine the conduct of research in India by 2025. For trial sites, this evolution presents a dual mandate: embrace digital transformation to seize new opportunities, and address the unique operational and regulatory challenges of a diverse, rapidly changing landscape. Students and emerging professionals who cultivate specialized skills in DCT design, technology management and cross-cultural engagement will find themselves at the forefront of a dynamic and socially impactful field. As India’s research ecosystem aligns with global best practices, decentralized trials promise greater inclusivity, efficiency and patient-centricity—paving the way for faster delivery of innovative therapies to millions in need. click here

Uncategorized

How Clinical Trial Sites Calculate Patient Recruitment Potential in India

Understanding 1. Introduction – Why Recruitment Forecasting Matters Clinical Recruitment Potential India click here Based on experience, in more than fifteen years of running Phase I–IV trials across Mumbai, Bengaluru, Hyderabad, and tier-2 cities, recruitment estimates have fluctuated significantly. In fact, actual enrollment has ranged from +30% above projections to as low as −50% below the original target. Therefore, relying solely on initial estimates without data validation can lead to major feasibility risks. The variance is rarely a statistical artifact; it is the result of how a site quantifies its patient pool, validates the data, and translates the numbers into a realistic enrollment plan (Clinical Recruitment Potential India). The purpose of this article is to walk sponsors, CROs, feasibility teams, and site managers through the exact steps a site in India takes to calculate patient recruitment potential. Importantly, the focus is on four critical pillars: speed, predictability, compliance, and data quality. Together, these elements protect trial timelines and budgets. Moreover, they ensure that regulatory expectations are consistently met while maintaining the highest standards of study integrity (Clinical Recruitment Potential India). Core Elements of a Recruitment Potential Model Understanding recruitment potential requires a structured and data-driven approach.Therefore, clinical trial sites must evaluate multiple variables that directly influence patient enrollment speed and overall feasibility. In addition, combining historical data with real-world insights enables the development of a more accurate and reliable recruitment forecast. As a result, sponsors can make better-informed decisions and minimize the risk of enrollment delays (Clinical Recruitment Potential India). Sr.No. Element Data Source Frequency of Update Typical Turn‑Around (days) Validation Method Compliance Checkpoint Key Metric Risk if Ignored Mitigation 1 Disease Prevalence in Catchment Area ICMR epidemiology reports, Hospital EMR Annually 7 Cross‑reference with national registries CDSCO data‑privacy audit Prevalence × Population Over‑estimation of pool Adjust with local physician surveys 2 Site‑Specific Patient Database Site EMR, OPD registers, Lab info system Monthly 5 Duplicate removal, de‑identification SOP‑001 (Data Handling) Unique Eligible Patients Duplicate counts inflate numbers Run SQL dedup scripts 3 Referral Network Strength Referral agreements, KOL outreach logs Quarterly 10 Referral conversion rate analysis Ethical Committee approval Referral‑to‑Screen Ratio Weak network stalls enrolment Activate digital referral portals 4 Eligibility Filter Compliance Protocol inclusion/exclusion matrix Per protocol amendment 2 Manual chart pull + algorithmic screening Sponsor QA sign‑off Screen‑Fail Rate High screen‑fail delays site start Early feasibility run‑in 5 Patient Accessibility Index Transport maps, socio‑economic data Bi‑annual 3 GIS mapping, travel time simulation Site IRB review Avg. travel time < 60 min Poor access reduces consent Provide travel stipend, satellite sites 6 Historical Enrollment Performance Past trial data (last 5 years) After each study 14 Trend analysis, regression CRO performance audit Enrollment‑per‑Month Ignoring trends repeats past bottlenecks Benchmark against similar therapeutic area 7 Investigator Engagement Score PI meeting minutes, KPI dashboards Monthly 2 Scoring rubric (0‑5) Sponsor‑site contract PI Commitment Level Low engagement leads to dropout Incentive‑based enrolment targets 8 Site Infrastructure Capacity Bed count, ICU, imaging slots Quarterly 4 Capacity utilisation report GCP compliance checklist Max Patients per Week Over‑booking compromises data quality Staggered enrolment windows 9 Regulatory Timeline Buffer DCGI/CSIR approvals, ethics clearance Per study 1 Gantt‑chart tracking CDSCO review log Buffer Days Missing buffer adds unforeseen delays Add 15 % contingency to each milestone 10 Patient Retention Forecast Follow‑up compliance logs Ongoing 1 Kaplan‑Meier analysis Sponsor DMC review Expected Drop‑out % High attrition erodes power Implement patient‑centric follow‑up plan Table 1 – Comprehensive recruitment model components used by high‑performing Indian sites. 3. Step‑by‑Step Calculation Workflow 3.1 Define the Catchment Geography 3.2 Extract the Site‑Specific Patient Pool Practical tip: Use the site’s EMR export function to pull every patient with the ICD‑10 code matching the disease. Clean the list with a de‑duplication script (SQL SELECT DISTINCT). Result: Raw eligible patient count (A). 3.3 Apply Protocol‑Specific Filters Filter Example Impact on Count Age range 18‑65 yr Reduce A by 12 % Laboratory value ALT < 2 × ULN Reduce A by 8 % Co‑morbidities Exclude uncontrolled diabetes Reduce A by 5 % Prior therapy No biologic exposure in last 6 months Reduce A by 7 % Sum of reductions yields Adjusted Eligible Patients (B). 3.4 Factor in Referral and Conversion Rates Historical conversion of referrals to screened patients in India averages 0.35 – 0.45. Multiply B by the site’s specific conversion factor (C). Screenable patients = B × C 3.5 Incorporate Operational Capacity Determine the maximum number of patients that can be processed per month based on: For example, if the recruitment capacity is 12 patients per month and the study duration is 9 months, then the maximum enrollable patients (D) equals 108. Therefore, accurately estimating monthly capacity is essential for setting realistic enrollment targets. As a result, it prevents overcommitment and ensures smoother trial execution. Ultimately, this leads to better timeline adherence and improved study outcomes. 3.6 Apply a Real‑World Buffer Add a 10 % buffer for unexpected screen‑fails, regulatory hold, or pandemic‑related disruptions. Final Recruitment Potential = min(Screenable patients, D) × 1.10 4. Practical Checklists 4.1 Data Collection Checklist 4.2 Validation Checklist 5. Common Mistakes and How to Avoid Them Stakeholder Typical Mistake Why It Happens Mitigation Sponsor Accepts site estimate without independent verification Time pressure, trust in CRO Require a second‑level feasibility audit using site‑provided raw data CRO Uses only disease prevalence, ignoring local access barriers Focus on macro data Add GIS travel‑time analysis to the model PI Over‑states referral network strength Desire to look proactive Validate with actual referral conversion numbers from the past 12 months Patient Assumes trial visits are free of indirect costs Lack of awareness Provide transparent stipend policies and transport support Site Manager Leaves eligibility filters to sponsor after site start Misunderstanding of SOP‑012 Conduct pre‑site‑start eligibility workshops 6. Myths vs Reality Myth Reality “India’s patient pool is unlimited because of population size.” Only a fraction (~2‑3 %) meet disease‑specific, protocol‑driven eligibility. “High prevalence guarantees fast enrolment.” Socio‑economic factors, health‑seeking behavior, and physician awareness are equally decisive. “Once a site signs a contract, recruitment is set.” Ongoing data refreshes and capacity re‑assessment are mandatory throughout the study. “Electronic health records eliminate manual screening.” Most Indian sites still rely on hybrid paper‑EMR systems; data quality varies

Investigator Site Selection Clinicaltrials
Uncategorized

How to Select the Right Investigator Site?

Why Site Selection Determines Timelines and Cost?Investigator Site Selection Clinicaltrials. In clinical development, every day of trial delay costs $600,000 to $8 million in lost revenue, depending on the asset class. The single largest contributor to recruitment delays more than protocol complexity or regulatory bottlenecks is poor site selection. Sponsors who rush into site activation without a structured, multi-dimensional feasibility assessment end up reacting to cascading delays: under-enrolled sites, data quality issues, protocol deviations, and ethics committee (EC) rejections due to incomplete documentation. The cost isn’t just time it’s the inability to reassign sites mid-trial and the downstream impact on NDA/BLA filing dates. India represents a high-potential geos for oncology, metabolic, and infectious disease trials due to its disease burden, physician engagement, and regulatory maturation. But selecting high-performing sites isn’t about population density or investigator fame. It’s about executional readiness, support infrastructure, patient access models, and consistent compliance. This guide provides a 12-point operational feasibility checklist built from real-world trial launches across 37 protocols and 168 Indian sites focused on predictability, IRB/DCGI responsiveness, and patient flow. It also evaluates the role of Site Management Organizations (SMOs) not as vendors, but as force multipliers that de-risk site activation and sustain recruitment momentum. If your last Phase 2 trial in India missed its enrollment target by >15%, the root cause wasn’t patient access—it was site feasibility done incorrectly. The Hidden Role of Site Management Organizations (SMOs) in Trial Success Rates Site selection is not a one-time activity. It’s a continuous diagnostic process that begins with feasibility and extends through activation, recruitment, and data lock. Yet most sponsors treat it as a form-filling exercise handled by a junior CRO project coordinator. This is where a competent Site Management Organization (SMO) alters the equation. Think of SMOs not as staffing agencies for clinical coordinators, but as executional arms that standardize site readiness. While CROs manage timelines and deliverables, SMOs manage the site engine—the day-to-day operations that keep patients flowing and data clean. SMOs reduce site activation timelines by 30–45 days on average by: A 2023 CDSCO inspection analysis of 54 Indian trial sites revealed that 78% of clinical trial delays originated from site-level operational gaps—staff turnover, incomplete source documentation, and ethics committee (EC) non-compliance—not IRB approval lag. SMOs with structured site support models reduced these gaps by 63% over 12 months (ICMR–NCDR Annual Report, 2023). “We stopped measuring site success by IRB approval time and started measuring it by first patient in within 30 days of approval. That shift forced us to use SMOs as operational partners—not just coordinators.” Former Head of Clinical Operations, Global Biotech (Phase 3 Oncology Trial, India, 2022) The 12-Point Feasibility Checklist: What Sponsors Should Actually Evaluate Feasibility is not a yes/no question. It’s a scoring model. Below is a field-tested 12-point checklist, ranked by impact on enrollment speed and data quality. Each criterion is weighted based on real-world performance across therapeutic areas and complexity levels. Feasibility Factor Weight Key Validation Method Evidence Source 1. Historical Enrollment Credibility 20% Actual recruitment vs. projected in past 3 studies CRO site performance logs, CTRI database 2. IRB/EC Engagement Efficiency 15% Days from submission to approval (target: ≤21 days) EC portal logs, SMO tracking data 3. Patient Access Model 15% Confirmed pre-screened pool ≥2× target Site-driven patient tracking logs 4. Site Staff Stability 10% Turnover rate (target: <20% annual) CVs, staff tenure records 5. SMO Integration Level 10% On-site presence, SOP adherence SMO audit reports, training logs 6. Source Document Completeness 8% % source data available at screening Site monitoring visit reports 7. Protocol Compliance Risk 8% Historical SDV findings (per 100 CRFs) CRO monitoring summaries 8. Lab & Diagnostic Readiness 5% On-site capabilities, central lab linkage Site infrastructure checklist 9. Regulatory Documentation Status 5% DCGI/EC submission package completeness Pre-feasibility document tracker 10. Financial & Contract Readiness 3% Template availability, negotiation bandwidth SMO contract team assessment 11. Investigator Time Commitment 3% Weekly patient load, trial portfolio Investigator time log (self-reported + SMO verified) 12. Geopolitical & Site Access Risk 3% Flood zones, power stability, transport access Site location risk map (SMO-generated)   Operational Insights: What Works (And What Doesn’t) What Works: Structured Feasibility Scoring with SMO Data Sponsors with internal feasibility teams often rely on investigator self-assessment. This is flawed. One sponsor (global Tier 1 pharma) found a 42% overestimation in patient availability when comparing investigator estimates to actual pre-screened pools verified by SMOs. Fix: Use SMOs to conduct on-site feasibility visits with documented patient flow analysis. At top-tier sites, coordinators review 3–6 months of EMR records (with consent) to identify eligible patients by ICD-10 codes. This reduces recruitment variability post-activation.   What Fails: Sole Reliance on IRB Approval Speed Fast IRB approval fast FPI. A site in Hyderabad once cleared ethics in 14 days but took 92 days to enroll Patient 1 due to: Lesson: IRB speed is only one pillar. It must be paired with activation readiness scoring.   What Works: Pre-Study Site Readiness Audits At Oxygen Clinical Research and Services, we deploy a 3-part site readiness audit before initiation: Sites passing all three start recruitment within 28 days of IRB approval a 68% improvement over non-audited sites. What Fails: Ignoring Investigator Portfolio Overload We once audited a “star” investigator with 12 active trials. Their site failed to randomize a single patient in a Phase 3 cardiovascular study. Root cause: coordinator team split across 4 studies, no dedicated time for patient follow-up. Fix: Cap investigator trial load at 3 active protocols max, especially in high-monitoring-demand trials. India-Specific Site Challenges: Hard Truths and Mitigation India offers scale. But scale without structure leads to failure. Below are sector-wide issues and mitigation strategies executed in real trials. Challenge 1: IRB/EC Variability and Delays While Schedule Y mandates ethics review within 30 days, median approval time is 38 days, with rural centers taking up to 72 days due to infrequent meeting schedules. EC Type Avg. Approval Time (Days) Common Delays Mitigation Strategy Institutional EC (Urban) 18–25 ICF formatting, CVs Pre-submission checklist, SMO liaison Independent

Clinicaltrial Myths India Patients
Uncategorized

Clinical Trial Misconceptions in India: Myths Patients Still Believe

By Govind Pawar, Senior Clinical Operations Leader, Oxygen Clinical Research and Services Clinicaltrial Myths India Patients. As India’s pharmaceutical and biotechnology sectors race toward cutting-edge therapies—ranging from novel cancer drugs to gene therapies and vaccines—clinical trials remain the gold standard for evaluating safety and efficacy. Despite regulatory reforms, improved ethical oversight, and high-profile successes such as indigenous COVID-19 vaccine candidates, patient trust in clinical research continues to lag. However, this gap highlights a deeper issue of perception and awareness. Moreover, when these myths are left unchecked, they do more than just slow recruitment. In fact, they actively hinder India’s progress as a global destination for responsible and world-class medical research. Therefore, addressing these misconceptions is not just important but essential for the future of clinical trials in India. In this opinionated report, we explore the most persistent patient myths, examine their roots and suggest practical steps to bridge the information gap—because understanding is the first step toward empowerment. Myth #1: “In Clinical Trials, You’re Just a Guinea Pig”The image of desperate volunteers strapped to an operating table, their bodies dissected for corporate profit, is a trope as old as research itself. Among many Indian patients, the fear persists that participation in a trial equates to involuntary experimentation, with little regard for their well-being. Newspapers occasionally highlight tragic accidents or allegations of consent violations. As a result, these reports reinforce the perception that clinical trials are inherently dangerous. Moreover, such coverage contributes to the spread of misinformation and strengthens existing fears among potential participants. Reality Check: India’s regulatory framework for clinical trials has been overhauled in recent years. The New Drugs and Clinical Trials Rules, 2019, introduced stringent timelines for regulatory decisions and mandated robust informed-consent procedures. Every trial proposal must pass scrutiny by an ethics committee registered with the Central Drugs Standard Control Organisation (CDSCO). These committees include medical experts, legal advisers and independent members to protect participants’ rights and safety. Myth #2: “Only the Poor and Illiterate Volunteer for Research”A second misconception paints trial volunteers as socioeconomically vulnerable: uneducated villagers who are lured by small incentives, unaware of potential risks. This stereotype not only stigmatizes participants from all walks of life but also overshadows the fact that many middle-class urbanites, chronically ill patients and patient-advocacy groups actively engage in research.  Reality Check: Clinical-trial participation in India spans a broad demographic spectrum. In metropolitan cities, tech-savvy patients with online access to clinical-trial registries voluntarily enroll in phase II and III trials of oncology, neurology and rare diseases. Many rare-disease support groups not only educate members about ongoing research but also collaborate directly with investigators. The government’s Clinical Trials Registry–India (CTRI) database is freely accessible online, enabling patients to search by disease category, trial phase and location. Increasingly, private hospitals in Tier II and III cities host well-monitored trials, with institutional ethics committees and standalone data-monitoring boards. Myth #3: “Pharma Companies Only Care About Profit, Not Patients” Many people believe that pharmaceutical companies focus only on profit.They think these companies promote unsafe or incomplete drugs in India.This belief comes from the idea that regulations are weak.It also assumes that trial participants are easy targets. Some even feel that foreign sponsors exploit these gaps.They believe India is used as a testing ground for drugs.These include antibiotics, antiretrovirals, and vaccines.They assume such drugs would not pass safety checks in Western countries. Reality Check:Some isolated incidents have occurred in the past.However, making broad generalizations is not helpful. Multinational companies follow international guidelines—including Good Clinical Practice (GCP) standards—and often submit the same protocols for global approval. In fact, data from Indian trial sites have contributed to global approvals of blockbuster drugs and transformed standards of care. The narrative that “all trials here are second-rate” ignores the growing cadre of world-class researchers based in India. Myth #4: “You’ll Never Get Follow-Up Care or Compensation”Another pervasive fear is that once the trial is over, participants are often cast aside and left without adequate medical support or long-term monitoring. Moreover, concerns about the lack of recourse for potential side effects further intensify this perception. As a result, such beliefs continue to reinforce common clinical trial myths in India and discourage patient participation. Skeptics point to confusion over compensation rules, believing that if they suffer harm, there is no mechanism for redress. Reality Check: Compensation provisions are built into Indian regulations. The New Drugs and Clinical Trials Rules stipulate a compensation formula for trial-related injury or death, calculated on the basis of age, risk and medical costs. Sponsors must create a compensation fund and deposit the required amount before enrolment begins. Additionally, ethics committees oversee insurance coverage and follow-up requirements, ensuring that participants receive medical care until their condition stabilizes. Myth #5: “Clinical Trials Are Always Conducted in Big Cities, Excluding Rural India”Many patients in small towns and villages believe that trials are the preserve of large urban hospitals, with rural and tribal populations cut off from potential benefits. This disconnect feeds mistrust: if communities never see research happening locally, they assume it’s “not for us.” Reality Check: India’s clinical-trial footprint has expanded well beyond big metros. With the government’s push to decentralize research, accredited clinics now exist in district hospitals, community health centres and private nursing homes across multiple states. Mobile clinical-trial units bring diagnostic facilities and trained personnel to remote areas, reducing travel burdens Clinicaltrial Myths India Patients. Why These Myths Persist The Stakes Are HighWithout public trust, India risks: Bridging the Information Gap: A Roadmap Voices from the Field Dr. Nandini *** ****, Chairperson of the State Ethics Review Board in Karnataka, shares her perspective.“Our biggest challenge isn’t scientific. It’s social.” We have the infrastructure and the expertise. Ramesh *** *****, a 58-year-old patient with chronic kidney disease from Meerut, shares his experience.“When my doctor first suggested a trial for a new dialysis adjunct, I was terrified.” . I had read stories online about trials gone wrong. Only after meeting the research team did I feel more confident.I also spoke with other participants, and as

Uncategorized

Clinical Trial Site Feasibility Assessment Workflow in India – A Complete Sponsor Guide

By Govind Pawar, Senior Clinical Operations Leader, Oxygen Clinical Research and Services 1. Introduction Clinicaltrial Feasibility Workflow India. Over the past decade, India has moved from a peripheral recruitment hub to a core contributor in global Phase II‑IV trials. The shift is not because of incentives alone; it is the result of a mature regulatory framework, a growing pool of qualified investigators, and an expanding network of capable sites. However, the speed and predictability of a study still hinge on a single, often under‑estimated activity: site feasibility assessment. In my 15 years of executing trials for Indian and global sponsors, I have seen sponsors either rush through feasibility and later confront protocol deviations, or spend months on exhaustive questionnaires only to lose the best sites to competing studies. The balance lies in a structured, data‑driven workflow that respects the Indian operational context while delivering the speed, compliance, and data quality sponsors demand. The following guide walks a sponsor through the end‑to‑end feasibility workflow as practiced by Oxygen Clinical Research and Services and leading CROs in India. It is grounded in field observations, includes practical tables and checklists, and highlights the trade‑offs that rarely appear in vendor brochures. 2. Why Feasibility Is the First Gatekeeper Aspect Typical Sponsor Expectation Indian Reality (Observed) Impact of Mismatch Patient pool size Census‑based estimates from epidemiology reports Regional disease clustering, referral patterns, and socio‑economic barriers affect enrolment Over‑recruitment targets, delayed timelines Investigator experience Number of published papers or past trial count Hands‑on GCP training, site staff turnover, and local ethics committee (EC) timelines matter more Protocol non‑compliance, protocol amendment requests Infrastructure Presence of a CTMS or electronic data capture (EDC) system Variable EMR integration, intermittent power, and internet bandwidth Data entry lag, increased monitoring effort Regulatory turnaround 30‑day EC approval quoted by many sites EC meeting frequency (monthly vs quarterly), state‑level approvals, and CDSCO review for certain INDs Unforeseen delays of 2‑4 weeks or more Budget compliance Fixed per‑patient cost Local taxes, GST, site‑specific overheads, and compensation norms for patients and staff Budget overruns, contract renegotiations The table underscores that feasibility is not a checklist exercise; each element interacts with the others. A robust workflow captures these interactions early, allowing sponsors to make informed trade‑offs between speed, cost, and data integrity. 3. Indian Regulatory and Operational Context Understanding these layers is essential when designing the feasibility questionnaire and when interpreting site responses. 4. Step‑by‑Step Feasibility Workflow Below is the workflow that Oxygen Clinical Research and Services follows for every new protocol. The steps are sequential but iterative; a failure at any point triggers a “go‑back” to the previous stage with a documented rationale. 4.1. Protocol Intake & Feasibility Scope Definition Action Owner Output Review protocol synopsis, inclusion/exclusion criteria, and primary endpoints Sponsor Clinical Lead Feasibility Scope Document (FSD) Identify therapeutic area experts within India CRO Medical Lead List of target investigator specialties Set target enrolment per site, timeline, and budget envelope Sponsor Finance & Operations Feasibility Parameters Sheet 4.2. Site Database Enrichment Data Source Frequency of Refresh Typical Lag Internal CRO site master Quarterly ≤ 30 days ICMR clinical trial registry Monthly ≤ 15 days State health department enrollment reports Bi‑annual ≤ 90 days Private hospital patient‑level EMR analytics Real‑time (if API available) Near‑real time Enrich the master list with the latest patient census, investigator turnover, and recent EC meeting minutes. 4.3. Preliminary Screening (Desk Review) Sites scoring < 3 on any critical element are either excluded or sent for targeted clarification. 4.4. Structured Feasibility Questionnaire Section Sample Question Rationale Patient Availability “Average number of new diagnosed patients per month for disease X in the last 12 months?” Quantifies realistic pool Investigator Commitment “Will the PI be available for ≥ 75 % of monitoring visits?” Predicts monitoring effort Regulatory Timeline “When is the next scheduled EC meeting?” Estimates approval date Site Staff Turnover “Number of CRA replacements in the past 12 months?” Anticipates operational continuity Compensation & Tax “What is the GST rate applied to sponsor payments?” Budget alignment Distribute the questionnaire electronically, allowing sites to upload supporting documents (e.g., patient logs, EC minutes). 4.5. Data Verification & Site Visit During the audit, capture process friction points (e.g., inconsistent SOPs for sample handling) and log them in the Feasibility Audit Report. 4.6. Feasibility Scoring & Decision Matrix Score Range Decision 85‑100 Proceed to Site Initiation (SI) 70‑84 Conditional – require corrective actions (e.g., additional training) < 70 Reject or place on “future watch” list The scoring algorithm weighs patient pool (40 %), investigator experience (20 %), infrastructure (20 %), regulatory timeline (10 %), and budget compliance (10 %). Adjust weights for therapeutic area specifics (e.g., oncology may give patient pool 50 %). 4.7. Feasibility Report & Sponsor Sign‑off The final deliverable includes: Sponsor sign‑off triggers the Site Initiation Pack (SIP) preparation. 5. Practical Checklists 5.1. Feasibility Questionnaire Checklist 5.2. On‑Site Audit Checklist 6. Challenges & Mitigation Strategies Challenge Why It Occurs Mitigation Inconsistent EC timelines ECs meet quarterly; some require quorum of external members Build a 2‑week buffer in the feasibility timeline; maintain a pre‑approved EC template to accelerate review Patient migration to private hospitals Public hospitals lose high‑income patients to private centers Include private‑hospital sites in the same region; negotiate data‑sharing agreements High staff turnover Competitive market for clinical research coordinators (CRCs) Offer site‑level training contracts (e.g., 12‑month CRC retention agreement) and performance‑based incentives GST impact on site payments Mis‑understanding of tax invoicing leads to delayed payments Provide a standard GST‑compliant invoice template; clarify that the sponsor’s budget includes GST Data protection compliance New Personal Data Protection Bill requires consent logs Integrate consent‑tracking module in EDC; conduct a site‑level data‑privacy audit before SI 7. Myths vs. Reality Myth Reality “A site that has enrolled > 200 patients in the last year will automatically meet our enrolment target.” Prior enrolment does not guarantee eligibility for the new protocol’s specific inclusion criteria. “If the PI has published extensively, the site will deliver high‑quality data.” Publication record does not reflect day‑to‑day GCP compliance; on‑site SOP adherence is a better predictor. “All Indian ECs process submissions within 30 days.” Many ECs operate on a monthly schedule; some require supplementary documents, extending

Electronic Medical Records Recruitment
Uncategorized

How Electronic Medical Records Improve Clinical Trial Recruitment Efficiency

Electronic Medical Records Recruitment. Govind Pawar – Senior Clinical Operations Leader, 15 + years in Indian and global trialsgovindpawar@oxygenclinicaltrials.com | www.oxygenclinicaltrials.com | www.linkedin.com/in/govind-pawar-42518511a Introduction Recruitment remains the single greatest cause of delay in Phase I‑IV studies across India. In my fifteen‑year career I have watched sites waste weeks sometimes months sifting through paper files, calling patients, and re‑checking eligibility against protocol criteria. The underlying problem is not a lack of patients; it is a lack of actionable data at the point of care. Electronic Medical Records (EMR) are the only systematic solution that can deliver that data in real time, and they do so while meeting Indian regulatory expectations for privacy and data integrity in Electronic Medical Records Recruitment This article explains, from an operational perspective, how EMR adoption shortens recruitment cycles, improves predictability, and safeguards compliance. It also outlines practical steps, common pitfalls, and mitigation strategies that sponsors, CROs, and site teams can apply today in Electronic Medical Records Recruitment 1. Baseline Recruitment Bottlenecks in India Sr. No. Typical Symptom Root Cause Impact on Timeline 1 Incomplete feasibility Reliance on manual chart review +30 days to identify potential sites 2 Low screen‑fail rate Protocol criteria not matched to real‑world data +45 days to reach target enrollment 3 Duplicate patient contact Multiple CROs query the same site +20 days for clarification 4 Inaccurate medical history Paper‑based transcriptions errors +15 days for re‑verification 5 Delayed ethics approval for data use Unclear consent pathways +10 days for amendment These bottlenecks are amplified in multi‑center studies where each site uses a different EMR platform or, more often, no EMR at all. The result is a fragmented data landscape that forces feasibility teams to “guess” eligibility and sponsors to build large safety buffers into their timelines in Electronic Medical Records Recruitment. 2. What EMR Brings to Recruitment 1.     Instant Cohort Identification – Structured diagnosis codes (ICD‑10), lab results, and medication histories are searchable across the patient population. 2.     Real‑Time Eligibility Flags – Automated rule engines can flag a patient the moment a new lab value is entered, eliminating the need for periodic manual pulls. 3.     Compliance‑Ready Audit Trail – Every query, view, and export is logged, satisfying CDSCO and ICMR requirements for data provenance. 4.     Reduced Duplicate Effort – Centralized patient identifiers prevent multiple CROs from contacting the same individual. 5.     Predictable Recruitment Metrics – Historical EMR data can be modeled to forecast enrollment rates with a ±10 % confidence interval, a precision rarely achieved with manual methods. In practice, sites that have integrated EMR with their eTMF and CTMS have reported a 30‑45 % reduction in time‑to‑first‑patient‑in (FPI) and a 20‑25 % increase in screen‑fail conversion. 3. Operational Benefits for Different Stakeholders Stakeholder EMR‑Enabled Benefit Measurable Outcome Sponsor Faster dose‑escalation decisions Study duration trimmed by 2–3 months CRO Leader Consolidated recruitment dashboard across sites Reduced monitoring visits by 15 % Clinical Operations Manager Automated eligibility checks Screening workload cut by 40 % Feasibility Team Data‑driven site selection Site qualification time cut from 6 weeks to 2 weeks Site PI Fewer manual chart reviews Time spent on recruitment activities reduced from 4 hrs/week to 1 hr/week Research Student Transparent data lineage Learning curve for GCP compliance shortened 4. Practical Implementation Checklist Item Description Owner Target Completion 1 Map protocol eligibility criteria to EMR data fields (diagnosis, labs, meds) Clinical Operations Within 2 weeks of study start 2 Validate EMR‑CTMS interface for data transfer integrity IT / CRO Data Management Prior to site activation 3 Obtain site‑level patient consent for secondary data use (ICMR Guideline 2017) PI / Ethics Committee Before first patient query 4 Configure automated eligibility alerts in EMR Site Informatics 1 week after go‑live 5 Train CRA and site staff on EMR search tools CRO Training Team During site initiation visit 6 Establish audit‑trail review process for regulatory inspection QA Lead Ongoing 7 Pilot the workflow on a low‑risk cohort and refine thresholds Sponsor Project Manager First month of recruitment 8 Document data‑privacy impact assessment per GDPR‑India draft Compliance Officer Before data export 9 Integrate EMR‑derived recruitment metrics into sponsor dashboard Data Scientist After 50 % enrollment 10 Conduct post‑study debrief on EMR performance All Stakeholders Within 30 days of study closeout 5. EMR Data Elements Relevant for Recruitment Sr.No. Patient ID Diagnosis (ICD‑10) Lab Test Result Date Medication Dosage Frequency Enrollment Flag 1 P001 E11.9 (Type 2 Diabetes) HbA1c 7.2 % 12‑Jan‑2024 Metformin 500 mg BID Yes 2 P012 I10 (Essential Hypertension) SBP 142 mmHg 05‑Feb‑2024 Lisinopril 10 mg OD No 3 P023 C34.1 (Lung Cancer) EGFR Mutated 20‑Mar‑2024 Erlotinib 150 mg OD Yes 4 P034 J45.909 (Asthma) FEV1 68 % predicted 08‑Apr‑2024 Salbutamol 100 µg PRN Yes 5 P045 M81.0 (Osteoporosis) BMD T‑Score −2.6 15‑May‑2024 Alendronate 70 mg WK No 6 P056 K21.9 (GERD) Endoscopy Loser 22‑Jun‑2024 Omeprazole 20 mg OD Yes 7 P067 F32.1 (Depression) PHQ‑9 16 30‑Jul‑2024 Sertraline 50 mg OD No 8 P078 G20 (Parkinson’s) UPDRS 35 12‑Aug‑2024 Levodopa 100 mg TID Yes 9 P089 H25.9 (Cataract) Visual Acuity 20/40 18‑Sep‑2024 None – – Yes 10 P090 R50.9 (Fever) CRP 3 mg/L 25‑Oct‑2024 Paracetamol 500 mg TID No Table 1: Sample EMR fields that can be directly mapped to protocol eligibility. The “Enrolment Flag” column is automatically set by the eligibility rule engine in Electronic Medical Records Recruitment. 6. Recruitment Workflow with EMR Integration Step Activity Owner Input Output Tool Time Saved (days) Risk Compliance Check KPI 1 Pull target cohort list Feasibility Analyst Diagnosis codes, labs Candidate list EMR query builder 7 Data mapping error ICMR consent log % candidates identified 2 Apply protocol filters CRA Candidate list Eligible list Eligibility engine 5 False positives Audit trail Screen‑fail rate 3 Generate patient outreach script Site Coordinator Eligible list Script + contact plan CRM 3 Script inaccuracies SOP adherence Outreach success 4 Contact patient & obtain consent PI/Study Nurse Script Signed consent e‑Consent platform 2 Consent refusal Informed consent form Consent conversion 5 Pre‑screen labs & vitals Lab Manager EMR real‑time data Clearance to enroll LIMS 1 Out‑of‑range labs Lab accreditation Pre‑screen pass 6 Randomize & schedule visit CRO Operations Clearance Randomization ID eTMF/CTMS 0.5 Randomization error CFR 21 Part 11 Enrollment time 7 Document enrollment Site Data Manager Randomization ID eCRF entry eDC system 0.5

Patient Availability Clinical Trial
Uncategorized

How to Demonstrate Patient Availability During Clinical Trial Feasibility in India

By Govind Pawar, Senior Clinical Operations Leader – 15 years experience across Indian and global sponsors, CROs and biotech partners Patient Availability Clinical Trial Introduction Demonstrating patient availability is the single most decisive factor when a feasibility team decides whether a protocol can be executed on time and within budget in India. In my fifteen‑year career I have seen sites lose a study because the sponsor relied on generic census data, and I have seen the same protocol succeed when the feasibility package contained granular, verified patient‑flow information. This article walks through the practical steps, common pitfalls and mitigation strategies that operational teams can apply to produce a robust, evidence‑based patient‑availability assessment for any therapeutic area in India. Why Generic Census Numbers Fail Sr.No. Issue Typical Assumption Real‑World Observation Impact on Timeline Impact on Budget 1 National disease prevalence “X % of Indian population has disease Y” Prevalence varies widely by state, urban vs rural, and socio‑economic tier Delayed site start‑up when recruitment slower than projected Extra monitoring visits, extended drug supply 2 Hospital inpatient census “Hospital admits 200 patients/month for condition Z” Admissions are driven by referral patterns; many patients are transferred elsewhere Site fails to meet enrollment targets Increased site‑level costs, sponsor penalties 3 Outpatient clinic footfall “Clinic sees 1,000 outpatients daily” Only a fraction meet protocol inclusion criteria (age, comorbidities, biomarker status) Low screen‑fail ratio, early stop‑go decisions postponed Waste of CRO resources on screening 4 Investigator’s perception “I see enough patients” Investigator optimism not backed by documented screening logs Unexpected drop‑outs, protocol amendments Additional source‑data verification (SDV) effort 5 Public health reports “Government data shows 50 k cases per year” Data often lagging by 12–24 months, missing private‑sector patients Under‑estimation of reachable pool Need for supplemental recruitment campaigns The above table illustrates that reliance on macro‑level data leads to under‑ or over‑estimation of the true enrolment capacity. Step‑by‑Step Framework to Demonstrate Patient Availability 1. Define the Target Patient Profile Sr.No. Parameter Source Practical Tip 1 Indication‑specific diagnostic criteria Latest ICMR guidelines, disease‑specific consensus statements Keep a copy of the guideline version used at the time of feasibility 2 Biomarker status (e.g., HER2, KRAS) Local pathology labs, central lab validation reports Verify assay turnaround time; request a 30‑day validation window 3 Disease stage / severity Hospital SOPs, oncology registry Capture stage distribution percentages from the past 12 months 4 Concomitant medication restrictions Sponsor protocol List common drugs in use locally; cross‑check with prescription patterns 5 Socio‑economic and literacy considerations Site’s patient‑education records Include an estimate of patients who can complete e‑consent A clear, site‑specific definition of the target population reduces ambiguity when you later quantify availability. Patient Availability Clinical Trial 2. Gather Historical Site Data What works: Sites that maintain a standardized screening log (date, indication, inclusion/exclusion status, outcome) can provide data within 48 hours. What fails: Sites that use handwritten notebooks often miss data, leading to incomplete feasibility reports. 3. Conduct a Field Visit Sr. No. Activity Duration Critical Observation 1 Walk‑through of outpatient department (OPD) 2 hrs Patient flow bottlenecks (registration, triage) 2 Interview of study coordinator 30 min Understanding of SOP adherence, workload 3 Review of electronic medical record (EMR) search capability 45 min Ability to run real‑time queries for inclusion criteria 4 Meet the principal investigator (PI) 30 min PI’s clinical trial experience, commitment level 5 Observe consent process 1 hr Patient comprehension, language barriers A site visit validates the numbers supplied in the logs and uncovers operational friction that may not be captured on paper. Patient Availability Clinical Trial 4. Quantify the Reachable Patient Pool Use the following formula, adjusted for each site: Reachable Pool = (Total diagnosed patients per month) Example (Oncology site in Mumbai): Rounded, the site can realistically enroll 07 patients per month for an EGFR‑targeted trial. 5. Build the Feasibility Package Sr. No. Section Content Requirements 1 Executive Summary High‑level enrolment forecast, risk rating 2 Site Profile Infrastructure, staff FTE, EMR capability 3 Patient Availability Analysis Data sources, calculations, assumptions 4 Risks & Mitigation Patient‑flow, regulatory, competition 5 Recommendations Recruitment strategy, timelines, monitoring plan All tables and calculations must be foot‑noted with the raw data source (e.g., “Screening Log – Jan 2024 – 31 entries”). Patient Availability Clinical Trial Practical Checklist for Feasibility Teams Sr.No. Checklist Item Owner Due Date 1 Obtain signed data‑sharing agreement with site CRO Legal Day 3 2 Request de‑identified screening logs (last 12 months) Feasibility Lead Day 5 3 Validate biomarker assay availability at local lab Lab Liaison Day 7 4 Schedule on‑site visit (incl. PI interview) Operations Manager Day 10 5 Run EMR query for target diagnosis Site IT Day 12 6 Populate Reachable Pool calculation template Analyst Day 14 7 Draft risk matrix (patient‑flow, competition) Risk Officer Day 16 8 Review package with sponsor’s medical lead Sponsor Medical Day 18 9 Final sign‑off and upload to sponsor portal Project Manager Day 20 Common Myths vs. Reality Myth Reality “A site with >200 OPD visits per day automatically guarantees enrolment” High footfall does not translate to eligible patients; inclusion/exclusion criteria filter out >80 % of visitors. “If the PI has published on the disease, the site is recruitment‑ready” Publication record does not reflect current staff capacity or EMR search capability. “Patient availability can be estimated from national disease registries alone” Registries lack granularity on stage, biomarker status, and willingness to participate in trials. “One site visit is sufficient to assess feasibility” Ongoing monitoring of patient flow, especially after competing studies start, is essential. “Electronic consent eliminates all literacy barriers” Language localization, cultural perception of research, and internet access still affect consent rates. Challenges and Mitigation Strategies Challenge Root Cause Mitigation Low consent conversion Complex consent language, lack of patient education Develop site‑specific visual aids; train coordinators in plain‑language communication Inaccurate screening logs Manual data entry errors Implement a lightweight e‑screening tool (e.g., REDCap) with validation rules Competition from parallel trials Same therapeutic area, overlapping eligibility Conduct a competitive landscape analysis; stagger recruitment windows Regulatory delays for biomarker testing Limited accredited labs in tier‑2 cities Pre‑qualify a network of labs; negotiate fast‑track approvals with CDSCO Staff turnover High turnover in contract research staff Maintain a

Uncategorized

Methods Used by Clinical Trial Sites to Identify Eligible Patients in India

Introduction – Why Patient Identification Matters In the Indian clinical‑research ecosystem, the speed and accuracy with which a site can pull the right patient into a trial often determines whether a study meets its enrolment timeline, stays within budget, and delivers compliant, high‑quality data. Over the past fifteen years, I have watched every recruitment model evolve—from simple chart reviews to sophisticated, AI‑driven outreach platforms. The reality on the ground, however, is that most sites still rely on a mix of low‑tech and high‑tech methods, each with its own operational friction. This article breaks down the methods we use today, highlights what works, where the gaps are, and offers a practical checklist that any sponsor, CRO, or site manager can apply immediately. 1. Conventional Methods Still in Use Sr.No. Method Typical Use‑Case Average Lead‑Time (Days) Data Source Regulatory Touch‑Points Success Rate (%) Common Pitfalls Mitigation 1 Manual Chart Review Large tertiary hospitals with EMR gaps 14‑21 Paper records, legacy EMRs Informed consent verification 30‑45 Missed records, inconsistent documentation Standardised abstraction template 2 Physician Referral Specialty clinics (oncology, cardiology) 7‑10 PI’s patient list PI’s NDA, IC signing 55‑70 Referral bias, over‑reliance on a single PI Rotate referral responsibility, cross‑check with EMR 3 Disease Registry Scraping Disease‑specific registries (e.g., ICMR TB registry) 10‑15 Registry databases Data‑privacy compliance (IT Act) 40‑60 Out‑dated entries, duplicate records Quarterly registry refresh, de‑duplication script 4 Community Outreach (NGOs, patient groups) Rural trials, rare diseases 21‑35 NGO member lists, local health workers Community consent, ethics committee approval 20‑35 Low literacy, mistrust Culturally adapted IEC materials, local language consent 5 Advertising (Print/Radio/Online) Consumer‑driven Phase II/III trials 30‑45 Public media, social platforms Advertising disclosures per CDSCO 10‑20 High drop‑out, low qualification Pre‑screening hotline, targeted geo‑filtering Quote: “Even after three years of digitising our records, we still spend 40 % of our recruitment time on manual chart pulls. The process is error‑prone but unavoidable without a unified EMR.” – Dr. Anjali Mehta, Principal Investigator, New Delhi 2. Technology‑Enabled Approaches Sr.No. Method Platform Example Integration Requirement Lead‑Time (Days) Success Rate (%) Cost (₹ ₹) Pros Cons 1 EMR‑based Eligibility Algorithms Medico, Healthify API access to hospital EMR, data‑mapping 3‑5 70‑85 ₹ 5‑10 L Real‑time alerts, minimal manual work Requires robust data governance 2 Clinical Trial Management System (CTMS) Patient Pools Veeva, Medidata CTMS‑to‑EMR linkage, user‑role configuration 4‑7 65‑80 ₹ 8‑12 L Centralised view across sites High upfront integration cost 3 AI‑driven Predictive Screening Deep Health, Quert Cloud‑based model, de‑identified data feed 2‑4 80‑90 ₹ 12‑20 L Predicts eligibility before chart review Black‑box perception, needs validation 4 Mobile Apps for Patient‑self‑screening MyTrials, TrialX App store deployment, GDPR‑style consent 5‑10 45‑60 ₹ 2‑4 L Scales to large populations quickly Digital literacy barrier 5 Wearable‑based Pre‑Screening Fitbit, Apple HealthKit SDK integration, data‑privacy agreement 3‑6 55‑70 ₹ 3‑6 L Captures real‑world vitals, continuous Device cost, adherence issues Operational Note: In my experience, sites that combined EMR‑based algorithms with a manual “clinical adjudication” step achieved the highest overall enrollment efficiency (≈ 78 %). The AI models alone produced false‑positives that overloaded site staff, while pure manual methods missed many eligible candidates.Patient recruitment clinical trials India 3. Hybrid Models – The Best‑Practice Blueprint A hybrid model leverages low‑tech outreach for awareness while using high‑tech tools for eligibility confirmation. The typical workflow is: Patient recruitment clinical trials India 1.       Awareness Generation – Community talks, NGO partnerships, and targeted digital ads. 2.       Pre‑Screening Capture – Mobile app or web form collects basic demographics and disease‑specific criteria. 3.       EMR‑Trigger – The pre‑screened data pushes a flag to the site’s EMR eligibility algorithm. 4.       Clinical Review – A research nurse reviews flagged records, confirms eligibility, and schedules consent. 5.       Enrolment Confirmation – Final eligibility check against the protocol, followed by e‑consent (if approved by the Ethics Committee). Why it works: The front‑end captures a broad pool, while the back‑end filters with high precision. The model reduces the “no‑show” rate from 35 % (pure advertising) to under 12 % when the clinical review step is added.Patient recruitment clinical trials India 4. Practical Checklist for Site Teams Sr. No. Checklist Item Responsible Role Frequency Documentation Required 1 Verify EMR‑API connectivity and data‑mapping accuracy IT Lead Monthly API log report 2 Update disease registry extract and run de‑duplication script Data Manager Quarterly Registry version log 3 Conduct patient‑facing consent language audit (local language) CRO QA Bi‑annual Revised IEC sheet 4 Run AI algorithm validation against a sample of 50 charts Clinical Lead Quarterly Validation report 5 Review advertising ROI and adjust geo‑targeting Marketing Ops Monthly Media spend vs enrollment chart 6 Train research nurses on pre‑screening questionnaire Site Manager Quarterly Training attendance sheet 7 Perform privacy impact assessment for mobile app data Compliance Officer Before launch PIA document 8 Cross‑check referral lists with EMR to eliminate overlap PI & Data Analyst Weekly Reconciliation spreadsheet 9 Update SOP for “Screen‑fail” documentation QA Lead As needed Revised SOP 10 Capture patient feedback on recruitment experience CRO Survey Team Ongoing Survey summary report Tip: Keep this checklist in a shared drive with version control; the most common cause of delayed recruitment is a missing or outdated SOP. 5. Challenges & Mitigation Strategies Challenge Root Cause Impact on Enrollment Mitigation Data silos across departments Lack of EMR integration 20‑30 % drop in eligible pool Deploy middleware that aggregates data in real time High “screen‑fail” ratio Over‑broad advertising Wasted site staff time, increased cost Refine inclusion criteria in ad copy, use pre‑screen filters Regulatory delays for e‑consent Inconsistent ethics‑committee guidance 2‑4 week lag Prepare a standard e‑consent dossier and engage EC early Patient mistrust in digital tools Low digital literacy, privacy concerns Low enrollment from urban tech‑savvy cohorts Conduct on‑site demo sessions, obtain explicit data‑use consent Staff turnover Frequent rotation of research nurses Knowledge loss, inconsistent processes Implement a “knowledge‑handover” workbook, schedule overlap weeks   6. Myths vs Reality Myth Reality “If we launch a massive digital ad campaign, enrollment will double.” Digital ads increase awareness but do not guarantee qualification; conversion rates remain < 20 % without pre‑screening. “AI will replace manual chart review.” AI can prioritize records but still requires clinician adjudication to meet GCP compliance. “Community outreach is

Scroll to Top