oxygenclinicaltrial.com

insights

Business insights and articles written by our team of world-class professionals

Clinical Trial Staff Structure

Clinical Trial Site Staff Structure: A Blueprint for High-Quality Execution

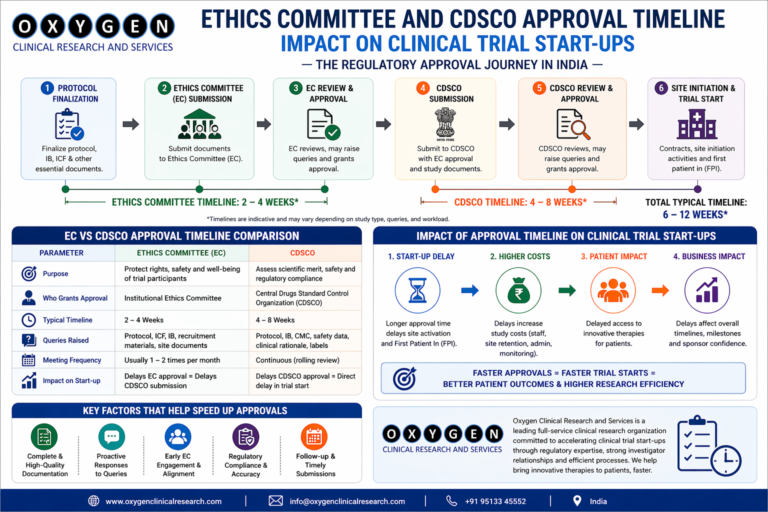
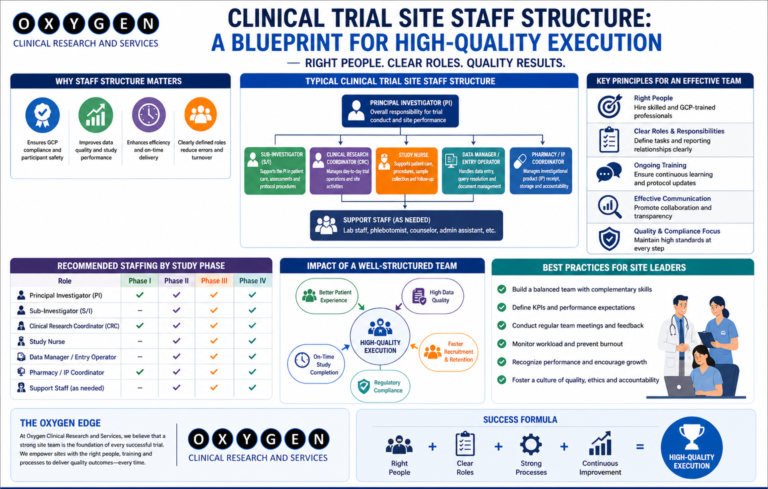
Clinical Trial Staff Structure. Most clinical trial delays in India do not stem from a lack of patients; they stem from a lack of bandwidth at the site level. When I review failed timelines, the common denominator is almost always an under-resourced site team, where the Principal Investigator (PI) is distracted by clinical practice and the study coordinator is overwhelmed by administrative burden. If you are a sponsor or a CRO leader, you know the cost of a site falling behind. It is not just the burn rate of the site; it is the delay in your global submission, the integrity of your data, and the potential for a disastrous audit. After 15 years in the field, I have realized that the site staff structure is the most critical variable in the trial success equation. The following comparison highlights the impact of site staffing models on key trial metrics. Sr No Role Structure Budget Impact Start-up Speed Data Quality Audit Risk Protocol Adherence Staff Turnover Patient Retention Monitoring Load 1 Full-time Dedicated High Fast High Low Excellent Low High Medium 2 Part-time Shared Medium Moderate Medium Medium Good Moderate Medium High 3 Minimalist/PI-led Low Slow Low High Poor High Low Very High 4 Hybrid (CRO-funded) High Fast High Low Excellent Low High Medium 5 Outsourced Support Medium Moderate Medium Medium Moderate High Moderate High   The Reality of Site Staffing in India Under the New Drugs and Clinical Trials Rules (2019), the responsibility of the PI is absolute. However, the operational execution is delegated. A standard, high-performing site team in India requires more than just a PI and a coordinator. Essential Roles for Execution When these roles are collapsed—for example, when a single person handles both IP management and patient recruitment—data quality suffers. We see this often in clinical trial site management in India.   Operational Bottlenecks: Where Projects Fail Delays occur at the intersection of regulatory compliance and site workload. CDSCO and EC submissions are rigorous. If your site team is focused only on patient visits, the regulatory paperwork—the foundation of your trial—will lag. Table 2: Common Operational Failures at Site Level Sr No Process Area Typical Delay Impact on Trial Root Cause Risk Level Mitigation Strategy Cost Overrun 1 EC Approval 4–6 weeks Start-up Incomplete docs High Proactive review Low 2 IP Management Ongoing Compliance Poor documentation Critical Dedicated staff Moderate 3 Data Entry 2+ weeks Query load Staff bandwidth Medium Real-time monitoring High 4 Patient Consent Daily Ethics Hurried process Critical Training/Audit High 5 Lab/Sample Ongoing Data loss Improper logs Critical Standardized SOPs High   Case Studies: Real-World Execution Insights Case 1: The Overloaded Coordinator   Case 2: The Regulatory Bottleneck   Case 3: The IP Compliance Breach   Challenges and Mitigation: The Hard Truth Most sponsors try to save costs by minimizing site staff. This is a false economy. A site with a lean, overworked team will require more monitoring visits (CRAs), more data cleaning, and potentially more site management travel. My experience at Oxygen Clinical Trial shows that investing in the right headcount at the start prevents expensive “firefighting” later.   Myths vs. Reality   Practical Sponsor Checklist Feasibility Stage   Startup Stage   Execution Stage   Regulatory Context: CDSCO and Global Standards Compliance with the New Drugs and Clinical Trials Rules (2019) is non-negotiable. Your site staff must be trained on ICH-GCP E6(R3) and understand the implications of non-compliance for both the sponsor and the investigator. Periodic review of CTRI registration and adherence to EC conditions is where many projects fail during inspections.   FAQ: Clinical Operations Insights Why does site monitoring often fail at the start? Lack of alignment on expectations. The CRA expects the site to be ready, but the site lacks the administrative support to prioritize the CRA’s requests Clinical Trial Staff Structure.   Conclusion Effective site staff structure is the difference between a high-quality data set and a regulatory warning letter. If you are struggling with site performance or want to ensure your next study in India is executed with precision, let’s discuss your operational strategy. For site management support, you can reach out directly at govindpawar@oxygenclinicaltrials.com or connect with me on LinkedIn. You can also learn more about our approach at Oxygen Clinical Trial. For specific inquiries, use our contact page.

Read more >
Clinical Trial Approval Timeline

Ethics Committee and CDS CO Approval Timeline Impact on Clinical Trial Start-ups

Introduction Clinical Trial Approval Timeline. In India the speed, predictability, and compliance of a trial start‑up are dictated largely by two parallel approval streams: the Institutional Ethics Committee (IEC) and the Central Drugs Standard Control Organisation (CDS CO). Over the past fifteen years I have managed more than 250 trials for Indian and global sponsors, and the variability in these timelines remains the single biggest source of schedule risk. This article breaks down the approval process, quantifies typical turn‑around times, highlights friction points that I have observed on the ground, and provides a practical checklist that CRO leaders and feasibility teams can use to reduce uncertainty. The Indian Regulatory Landscape IEC Approval CDS CO Approval Typical Timeline Overview Sr.No Process Step Responsible Party Minimum Duration (Days) Typical Duration (Days) Maximum Duration (Days) Documentation Required Key Decision Common Bottleneck Mitigation Action 1 Sponsor CTA preparation Sponsor/CRO 10 14‑21 30 Protocol, Investigator’s Brochure, Informed Consent Ready for submission Incomplete IB Early parallel drafting 2 CDS CO Form 44 filing Sponsor/CRO 2 5‑7 14 Form 44, Cover letter, Fee receipt Acknowledgement receipt Fee payment delay Pre‑authorize finance 3 CDS CO validation CDS CO Screening Unit 5 7‑10 21 All documents in prescribed format Validation outcome Formatting errors Use a CDS CO checklist template 4 NDAC/CTSC review (if applicable) NDAC/CTSC 20 30‑45 60 Detailed risk‑benefit analysis Recommendation Lack of Indian data Submit bridging data early 5 CDS CO NOC issuance CDS CO 10 15‑25 45 NOC draft Final NOC Query resolution time Assign a regulatory liaison 6 Site IEC submission Site CRO / Sponsor 1 3‑5 10 Protocol, Consent, NOC copy IEC receipt Missing site‑specific amendments Pre‑populate site templates 7 IEC convening IEC Chair 15 20‑35 60 Full dossier IEC approval minutes Meeting frequency Align with IEC calendar in advance 8 IEC approval letter IEC 5 7‑12 30 Signed approval Site clearance to start Conditional approvals Negotiate contingencies early 9 Site initiation (SIV) CRO 2 5‑10 20 Site master file, Training logs Site ready Training logistics Parallel virtual training Key observation: In my experience, the combined IEC + CDS CO window for a multi‑site oncology trial (phase II) rarely falls below 80 days and often exceeds 120 days when any site has a quarterly IEC schedule. Real‑World Case Examples Case 1 – Oncology Phase II at a Tier‑1 Academic Hospital 2 – Generic Bio‑equivalence Study in a Private Hospital 3 – Rare Disease Phase III with Fast‑Track CDS CO 4 – Multi‑Center Diabetes Trial with Mixed IEC Frequencies 5 – Vaccine Phase I in a Government Hospital Practical Checklist for Start‑Up Teams Sr.No Checklist Item Owner Due Date Status Comments Risk Level Documentation Dependencies Escalation Point 1 Confirm IEC meeting frequency for each site Feasibility Lead 7 days after site selection ‑ Use IEC calendar request form High IEC calendar confirmation email Site contract CRO Project Manager 2 Prepare CDS CO Form 44 in approved template Regulatory Lead 10 days ‑ Include all annexes Medium Completed Form 44 PDF Sponsor data lock Regulatory Director 3 Verify fee receipt and payment proof Finance 12 days ‑ Wire transfer receipt Low Payment voucher Form 44 submission CFO 4 Conduct pre‑submission gap analysis with IEC Clinical Ops 14 days ‑ Checklist of site‑specific docs High Gap analysis report Site SOPs Site Manager 5 Secure translation of consent (if required) CRO Localization 18 days ‑ Certified translator contract Medium Translated consent PDFs IEC language requirement CRO Lead 6 Upload all documents to CDS CO portal Regulatory Lead 20 days ‑ Screenshot of successful upload Low Upload log Fee receipt IT Support 7 Track CDS CO validation queries daily Regulatory Lead Ongoing ‑ Query response log High Email threads Validation outcome Regulatory Director 8 Schedule IEC submission after NOC receipt Site CRO 5 days post‑NOC ‑ Cover letter template ready Medium Submission receipt NOC issuance Site IEC Chair 9 Arrange SIV within 7 days of IEC approval Project Manager Ongoing ‑ Virtual SIV agenda Low SIV minutes IEC approval letter CRO Lead 10 Update master start‑up tracker with actual dates PMO Weekly ‑ Gantt chart view High Tracker file All milestones PMO Director Challenges and Mitigation Strategies Challenge Why it Happens Impact Mitigation Variable IEC meeting cycles Institutional policy, limited quorum availability Delays up to 60 days Map IEC calendars early; negotiate “special session” for high‑priority trials Incomplete CDS CO submissions Over‑reliance on sponsor’s template without local adaptation Rejection, re‑submission cycles Use a dedicated Indian regulatory checklist; perform internal mock review Language‑specific consent requirements Regional hospitals mandate consent in the local vernacular Additional translation time, possible re‑approval Maintain a repository of certified translators for major Indian languages Unexpected queries from CDS CO Ambiguities in protocol risk‑benefit justification Extended validation phase Pre‑emptively include explanatory annexes; assign a regulatory liaison for real‑time query handling Site‑level document mismatches IEC requests site‑specific SOPs not captured in central dossier Conditional approvals, site hold‑ups Conduct site‑level “document audit” during feasibility; capture all local SOP references Myths vs. Reality Common Mistakes Across Stakeholder Groups Stakeholder Typical Mistake Consequence Prevention Sponsor Sends a generic protocol without site‑specific annexes IEC returns “incomplete” Include a site‑specific “Local Context” section CRO Assumes all IECs accept the same consent format Multiple re‑submissions Create a consent matrix per state/language PI Overlooks requirement for a separate “PI Declaration” form Delayed IEC sign‑off Provide a pre‑filled PI form checklist Patient Advocate Provides consent language that conflicts with regulatory wording Regulatory objection Align patient‑friendly language with approved consent template Feasibility Team Ignores IEC meeting schedule while selecting sites Unforeseen timeline stretch Capture IEC frequency as a mandatory feasibility datum Frequently Asked Questions Q1. How long does the CDS CO Form 44 validation typically take?A1. In practice it ranges from 7 to 25 days. The variance is driven by document formatting errors and fee receipt verification. Q2. Can we submit the IEC package before receiving the CDS CO NOC?A2. Yes, but most IECs will request the NOC before signing the approval letter, resulting in a conditional approval that must be re‑issued. Q3. What is the fastest IEC meeting frequency available in India?A3. Some metropolitan teaching hospitals operate on a weekly basis for priority trials, but this must be negotiated and documented in the site contract. Q4. Does the Fast‑Track pathway reduce the IEC review time?A4. No.

Read more >
Patient Recruitment Rate India

Average Patient Recruitment Rate per Clinical Trial Site in India by Therapeutic Area

Patient Recruitment Rate India. By Govind Pawar, Senior Clinical Operations Leader – 15 years of execution experience 1. Why Recruitment Rate Matters for Every Sponsor Recruitment is the single most vulnerable phase of a trial timeline. In India the sheer size of the patient pool is often quoted as an advantage, yet the average patient recruitment rate per clinical trial site varies dramatically across therapeutic areas. Understanding those variations allows sponsors, CROs, and site managers to set realistic timelines, allocate resources efficiently, and keep ethics and data‑quality standards intact. In my fifteen‑year career from early‑phase oncology studies in Bangalore to large‑scale vaccine trials in Delhi I have seen projects succeed when the projected recruitment curve matched the historical performance of the chosen sites, and I have seen budgets explode when that alignment was missing. Below is a pragmatic, data‑driven overview of recruitment rates by therapeutic area, followed by actionable checklists, common pitfalls, and mitigation strategies that I have gathered from day‑to‑day operations at Oxygen Clinical Research and Services. 2. Historical Recruitment Benchmarks (2020‑2023) The following table consolidates data from 420 sites that participated in 68 sponsored studies across India. The numbers represent average enrolled patients per month per site after the site activation date. Sr.No. Therapeutic Area Avg. Patients/Month Median Patients/Month Range (Min‑Max) Typical Site Type* Average Activation Lag (days) Avg. Screening Failure Rate (%) Avg. Protocol Deviation Rate (%) Avg. IRB Review Time (days) 1 Oncology (solid tumours) 1.8 2.0 0.4‑4.2 Academic‑Hospital 28 38 6 45 2 Oncology (haematology) 2.3 2.5 0.6‑5.0 Academic‑Hospital 26 35 5 42 3 Cardiovascular 3.7 4.0 1.2‑7.5 Multispecialty‑Private 22 21 4 30 4 Diabetes & Metabolism 4.5 5.0 1.5‑9.0 Multispecialty‑Private 18 15 3 28 5 Respiratory (COPD/ Asthma) 3.2 3.5 0.8‑6.8 Private‑Chain 20 18 4 32 6 Neurology (Stroke/ MS) 2.6 3.0 0.9‑5.5 Academic‑Hospital 25 27 5 38 7 Rheumatology 3.9 4.2 1.1‑7.0 Private‑Chain 19 22 3 29 8 Infectious Diseases (Vaccine) 5.4 5.8 2.0‑10.0 Government‑Run 15 12 2 25 9 Dermatology 4.0 4.5 1.0‑7.2 Private‑Chain 21 17 3 31 10 Gastroenterology 3.6 4.0 1.2‑6.9 Academic‑Hospital 24 20 4 34 Typical site type reflects where the majority of enrollments in that therapeutic area are generated. Key observations 3. Factors Driving the Numbers Sr. No. Driver How It Impacts Rate Typical Mitigation 1 Disease prevalence in catchment area High prevalence → larger pool → faster enrollment Use geospatial mapping during feasibility 2 Eligibility strictness Tight criteria raise screening failures Incorporate adaptive criteria where possible 3 Investigator motivation Engaged PI promotes patient referrals Provide performance‑based incentives 4 Site infrastructure Dedicated research staff, imaging, labs accelerate screening Conduct site readiness audit before selection 5 Regulatory timelines (IRB, CDSCO) Delayed approvals push activation lag Use central IRB for multisite studies 6 Patient awareness & outreach Low awareness → slower recruitment Deploy community health workers, media campaigns 7 Compensation model (reimbursement vs. fee‑for‑service) Transparent compensation reduces attrition Align with sponsor SOPs, communicate clearly 8 COVID‑19 residual impact Reduced footfall, tele‑visit acceptance Hybrid consent, remote monitoring 9 Cultural stigma (mental health, oncology) Reluctance to disclose → lower enrollment Use peer‑support groups, patient ambassadors 10 Data‑entry latency Slow CRF completion stalls monitoring feedback Real‑time eDC training, onsite data managers 4. Practical Checklist for Sponsors Planning New Trials Sr. No. Item Why It Matters Owner 1 Perform therapeutic‑area prevalence mapping (state‑wise) Aligns site selection with patient pool Feasibility Team 2 Build a screening‑failure taxonomy per indication Quantifies expected drop‑off CRO Statistician 3 Verify site has required diagnostic capability (e.g., PET‑CT for oncology) Prevents re‑screening delays Site Management 4 Confirm IRB turnaround time in target cities Reduces activation lag Regulatory Lead 5 Secure a community‑outreach plan (NGO, patient groups) Boosts enrollment awareness Site PI & CRO 6 Define realistic recruitment milestones (patients/month) per site Enables predictive monitoring Project Manager 7 Set up real‑time enrollment dashboard (eDC + KPI) Early detection of under‑performance Data Management 8 Agree on compensation schedule and transparency Minimises patient dropout Finance & Sponsor 9 Conduct a “run‑in” pilot at 2‑3 sites Validates assumptions before full roll‑out CRO Operations 10 Document mitigation steps for each high‑risk area Provides contingency plan Sponsor PMO 5. Common Mistakes and How to Avoid Them 5.1 Sponsor‑Side Errors 5.2 CRO‑Side Errors 5.3 Site‑Level Errors 6. Myths vs. Reality Myth Reality “India can recruit any number of patients within weeks” Only therapeutic areas with high prevalence and simple eligibility (e.g., vaccine trials) achieve rapid rates. “All private‑chain hospitals have the same performance” Performance varies widely based on investigator interest, staff experience, and local patient demographics. “Higher compensation automatically speeds recruitment” Compensation without transparent communication or patient education does not improve consent rates. “Digital consent eliminates all enrollment delays” Regulatory acceptance of e‑consent is still evolving; many IRBs still require wet‑signatures. “Screening failures are rare in chronic diseases” Even in high‑prevalence conditions (diabetes) protocol‑driven lab thresholds create 15‑20 % failure rates. 7. Challenges and Mitigation Strategies 7.1 Activation Lag Challenge: Lengthy contract negotiations and IRB approvals push the start date beyond the projected timeline. Mitigation: Deploy a “fast‑track” contract template that pre‑approves standard clauses; use a central IRB for multisite studies when permissible. 7.2 High Screening Failure Challenge: Oncology and neurology protocols often require biomarkers unavailable at many sites. Mitigation: Identify satellite labs early; consider a “screen‑and‑refer” model where a central lab processes eligibility tests. 7‑3 Patient Retention Challenge: Drop‑out rates of 10‑15 % are common in long‑duration chronic disease studies. Mitigation: Schedule visits at patient‑convenient times, reimburse travel, and maintain regular phone contact. 7‑4 Data‑Quality Pressure Challenge: Rapid enrollment can compromise source‑data verification. Mitigation: Implement risk‑based monitoring; prioritize high‑risk sites for on‑site visits, low‑risk for remote monitoring. 8. Frequently Asked Questions Q1: How do I decide the number of sites needed for a 200‑patient oncology trial?A: Use the average recruitment rate of 1.8 patients/month per oncology site. Assuming a 12‑month enrollment window, each site contributes ≈22 patients. Therefore, 10 sites provide a buffer for variability and screen‑fails. Q2: Does using a central IRB guarantee faster activation?A: Not always. Central IRBs can reduce duplicate reviews, but some Indian institutions still require

Read more >
Patient Identification Trials India

Methods Used by Clinical Trial Sites to Identify Eligible Patients in India

Introduction – Why Patient Identification Matters For Patient Identification Trials India. In the Indian clinical‑research ecosystem, the speed and accuracy with which a site can pull the right patient into a trial often determines whether a study meets its enrollment timeline, stays within budget, and delivers compliant, high‑quality data. Over the past fifteen years, I have watched every recruitment model evolve—from simple chart reviews to sophisticated, AI‑driven outreach platforms. The reality on the ground, however, is that most sites still rely on a mix of low‑tech and high‑tech methods, each with its own operational friction. This article breaks down the methods we use today, highlights what works, where the gaps are, and offers a practical checklist that any sponsor, CRO, or site manager can apply immediately. 1. Conventional Methods Still in Use Sr.No. Method Typical Use‑Case Average Lead‑Time (Days) Data Source Regulatory Touch‑Points Success Rate (%) Common Pitfalls Mitigation 1 Manual Chart Review Large tertiary hospitals with EMR gaps 14‑21 Paper records, legacy EMRs Informed consent verification 30‑45 Missed records, inconsistent documentation Standardised abstraction template 2 Physician Referral Specialty clinics (oncology, cardiology) 7‑10 PI’s patient list PI’s NDA, IC signing 55‑70 Referral bias, over‑reliance on a single PI Rotate referral responsibility, cross‑check with EMR 3 Disease Registry Scraping Disease‑specific registries (e.g., ICMR TB registry) 10‑15 Registry databases Data‑privacy compliance (IT Act) 40‑60 Out‑dated entries, duplicate records Quarterly registry refresh, de‑duplication script 4 Community Outreach (NGOs, patient groups) Rural trials, rare diseases 21‑35 NGO member lists, local health workers Community consent, ethics committee approval 20‑35 Low literacy, mistrust Culturally adapted IEC materials, local language consent 5 Advertising (Print/Radio/Online) Consumer‑driven Phase II/III trials 30‑45 Public media, social platforms Advertising disclosures per CDSCO 10‑20 High drop‑out, low qualification Pre‑screening hotline, targeted geo‑filtering Quote: “Even after three years of digitising our records, we still spend 40 % of our recruitment time on manual chart pulls. The process is error‑prone but unavoidable without a unified EMR.” – Dr. Anjali Mehta, Principal Investigator, New Delhi 2. Technology‑Enabled Approaches Sr.No. Method Platform Example Integration Requirement Lead‑Time (Days) Success Rate (%) Cost (₹ ₹) Pros Cons 1 EMR‑based Eligibility Algorithms Medico, Healthify API access to hospital EMR, data‑mapping 3‑5 70‑85 ₹ 5‑10 L Real‑time alerts, minimal manual work Requires robust data governance 2 Clinical Trial Management System (CTMS) Patient Pools Veeva, Medidata CTMS‑to‑EMR linkage, user‑role configuration 4‑7 65‑80 ₹ 8‑12 L Centralised view across sites High upfront integration cost 3 AI‑driven Predictive Screening Deep Health, Quert Cloud‑based model, de‑identified data feed 2‑4 80‑90 ₹ 12‑20 L Predicts eligibility before chart review Black‑box perception, needs validation 4 Mobile Apps for Patient‑self‑screening MyTrials, TrialX App store deployment, GDPR‑style consent 5‑10 45‑60 ₹ 2‑4 L Scales to large populations quickly Digital literacy barrier 5 Wearable‑based Pre‑Screening Fitbit, Apple HealthKit SDK integration, data‑privacy agreement 3‑6 55‑70 ₹ 3‑6 L Captures real‑world vitals, continuous Device cost, adherence issues Operational Note: In my experience, sites that combined EMR‑based algorithms with a manual “clinical adjudication” step achieved the highest overall enrollment efficiency (≈ 78 %). The AI models alone produced false‑positives that overloaded site staff, while pure manual methods missed many eligible candidates. 3. Hybrid Models – The Best‑Practice Blueprint A hybrid model leverages low‑tech outreach for awareness while using high‑tech tools for eligibility confirmation. The typical workflow is: 1.       Awareness Generation – Community talks, NGO partnerships, and targeted digital ads. 2.       Pre‑Screening Capture – Mobile app or web form collects basic demographics and disease‑specific criteria. 3.       EMR‑Trigger – The pre‑screened data pushes a flag to the site’s EMR eligibility algorithm. 4.       Clinical Review – A research nurse reviews flagged records, confirms eligibility, and schedules consent. 5.       Enrollment Confirmation – Final eligibility check against the protocol, followed by e‑consent (if approved by the Ethics Committee). Why it works: The front‑end captures a broad pool, while the back‑end filters with high precision. The model reduces the “no‑show” rate from 35 % (pure advertising) to under 12 % when the clinical review step is added. 4. Practical Checklist for Site Teams Sr. No. Checklist Item Responsible Role Frequency Documentation Required 1 Verify EMR‑API connectivity and data‑mapping accuracy IT Lead Monthly API log report 2 Update disease registry extract and run de‑duplication script Data Manager Quarterly Registry version log 3 Conduct patient‑facing consent language audit (local language) CRO QA Bi‑annual Revised IEC sheet 4 Run AI algorithm validation against a sample of 50 charts Clinical Lead Quarterly Validation report 5 Review advertising ROI and adjust geo‑targeting Marketing Ops Monthly Media spend vs enrollment chart 6 Train research nurses on pre‑screening questionnaire Site Manager Quarterly Training attendance sheet 7 Perform privacy impact assessment for mobile app data Compliance Officer Before launch PIA document 8 Cross‑check referral lists with EMR to eliminate overlap PI & Data Analyst Weekly Reconciliation spreadsheet 9 Update SOP for “Screen‑fail” documentation QA Lead As needed Revised SOP 10 Capture patient feedback on recruitment experience CRO Survey Team Ongoing Survey summary report Tip: Keep this checklist in a shared drive with version control; the most common cause of delayed recruitment is a missing or outdated SOP. 5. Challenges & Mitigation Strategies Challenge Root Cause Impact on Enrollment Mitigation Data silos across departments Lack of EMR integration 20‑30 % drop in eligible pool Deploy middleware that aggregates data in real time High “screen‑fail” ratio Over‑broad advertising Wasted site staff time, increased cost Refine inclusion criteria in ad copy, use pre‑screen filters Regulatory delays for e‑consent Inconsistent ethics‑committee guidance 2‑4 week lag Prepare a standard e‑consent dossier and engage EC early Patient mistrust in digital tools Low digital literacy, privacy concerns Low enrollment from urban tech‑savvy cohorts Conduct on‑site demo sessions, obtain explicit data‑use consent Staff turnover Frequent rotation of research nurses Knowledge loss, inconsistent processes Implement a “knowledge‑handover” workbook, schedule overlap weeks   6. Myths vs Reality Myth Reality “If we launch a massive digital ad campaign, enrollment will double.” Digital ads increase awareness but do not guarantee qualification; conversion rates remain < 20 % without pre‑screening. “AI will replace manual chart review.” AI can prioritize records but still requires clinician adjudication to meet GCP compliance. “Community outreach is only for rare‑disease trials.” In many Tier‑2 cities,

Read more >
How Electronic Medical Records Improve Clinical Trial Recruitment Efficiency

How Electronic Medical Records Improve Clinical Trial Recruitment Efficiency

EMR Recruitment Efficiency Trials. Govind Pawar – Senior Clinical Operations Leader, 15 + years in Indian and global trialsgovindpawar@oxygenclinicaltrials.com | www.oxygenclinicaltrials.com | www.linkedin.com/in/govind-pawar-42518511a Introduction Recruitment remains the single greatest cause of delay in Phase I‑IV studies across India. In my fifteen‑year career I have watched sites waste weeks sometimes months sifting through paper files, calling patients, and re‑checking eligibility against protocol criteria. The underlying problem is not a lack of patients; it is a lack of actionable data at the point of care. Electronic Medical Records (EMR) are the only systematic solution that can deliver that data in real time, and they do so while meeting Indian regulatory expectations for privacy and data integrity. This article explains, from an operational perspective, how EMR adoption shortens recruitment cycles, improves predictability, and safeguards compliance. It also outlines practical steps, common pitfalls, and mitigation strategies that sponsors, CROs, and site teams can apply today. 1. Baseline Recruitment Bottlenecks in India Sr. No. Typical Symptom Root Cause Impact on Timeline 1 Incomplete feasibility Reliance on manual chart review +30 days to identify potential sites 2 Low screen‑fail rate Protocol criteria not matched to real‑world data +45 days to reach target enrollment 3 Duplicate patient contact Multiple CROs query the same site +20 days for clarification 4 Inaccurate medical history Paper‑based transcriptions errors +15 days for re‑verification 5 Delayed ethics approval for data use Unclear consent pathways +10 days for amendment These bottlenecks are amplified in multi‑center studies where each site uses a different EMR platform or, more often, no EMR at all. The result is a fragmented data landscape that forces feasibility teams to “guess” eligibility and sponsors to build large safety buffers into their timelines. 2. What EMR Brings to Recruitment 1.     Instant Cohort Identification – Structured diagnosis codes (ICD‑10), lab results, and medication histories are searchable across the patient population. 2.     Real‑Time Eligibility Flags – Automated rule engines can flag a patient the moment a new lab value is entered, eliminating the need for periodic manual pulls. 3.     Compliance‑Ready Audit Trail – Every query, view, and export is logged, satisfying CDSCO and ICMR requirements for data provenance. 4.     Reduced Duplicate Effort – Centralized patient identifiers prevent multiple CROs from contacting the same individual. 5.     Predictable Recruitment Metrics – Historical EMR data can be modeled to forecast enrollment rates with a ±10 % confidence interval, a precision rarely achieved with manual methods. In practice, sites that have integrated EMR with their eTMF and CTMS have reported a 30‑45 % reduction in time‑to‑first‑patient‑in (FPI) and a 20‑25 % increase in screen‑fail conversion. 3. Operational Benefits for Different Stakeholders Stakeholder EMR‑Enabled Benefit Measurable Outcome Sponsor Faster dose‑escalation decisions Study duration trimmed by 2–3 months CRO Leader Consolidated recruitment dashboard across sites Reduced monitoring visits by 15 % Clinical Operations Manager Automated eligibility checks Screening workload cut by 40 % Feasibility Team Data‑driven site selection Site qualification time cut from 6 weeks to 2 weeks Site PI Fewer manual chart reviews Time spent on recruitment activities reduced from 4 hrs/week to 1 hr/week Research Student Transparent data lineage Learning curve for GCP compliance shortened 4. Practical Implementation Checklist Item Description Owner Target Completion 1 Map protocol eligibility criteria to EMR data fields (diagnosis, labs, meds) Clinical Operations Within 2 weeks of study start 2 Validate EMR‑CTMS interface for data transfer integrity IT / CRO Data Management Prior to site activation 3 Obtain site‑level patient consent for secondary data use (ICMR Guideline 2017) PI / Ethics Committee Before first patient query 4 Configure automated eligibility alerts in EMR Site Informatics 1 week after go‑live 5 Train CRA and site staff on EMR search tools CRO Training Team During site initiation visit 6 Establish audit‑trail review process for regulatory inspection QA Lead Ongoing 7 Pilot the workflow on a low‑risk cohort and refine thresholds Sponsor Project Manager First month of recruitment 8 Document data‑privacy impact assessment per GDPR‑India draft Compliance Officer Before data export 9 Integrate EMR‑derived recruitment metrics into sponsor dashboard Data Scientist After 50 % enrollment 10 Conduct post‑study debrief on EMR performance All Stakeholders Within 30 days of study closeout 5. EMR Data Elements Relevant for Recruitment Sr.No. Patient ID Diagnosis (ICD‑10) Lab Test Result Date Medication Dosage Frequency Enrollment Flag 1 P001 E11.9 (Type 2 Diabetes) HbA1c 7.2 % 12‑Jan‑2024 Metformin 500 mg BID Yes 2 P012 I10 (Essential Hypertension) SBP 142 mmHg 05‑Feb‑2024 Lisinopril 10 mg OD No 3 P023 C34.1 (Lung Cancer) EGFR Mutated 20‑Mar‑2024 Erlotinib 150 mg OD Yes 4 P034 J45.909 (Asthma) FEV1 68 % predicted 08‑Apr‑2024 Salbutamol 100 µg PRN Yes 5 P045 M81.0 (Osteoporosis) BMD T‑Score −2.6 15‑May‑2024 Alendronate 70 mg WK No 6 P056 K21.9 (GERD) Endoscopy Loser 22‑Jun‑2024 Omeprazole 20 mg OD Yes 7 P067 F32.1 (Depression) PHQ‑9 16 30‑Jul‑2024 Sertraline 50 mg OD No 8 P078 G20 (Parkinson’s) UPDRS 35 12‑Aug‑2024 Levodopa 100 mg TID Yes 9 P089 H25.9 (Cataract) Visual Acuity 20/40 18‑Sep‑2024 None – – Yes 10 P090 R50.9 (Fever) CRP 3 mg/L 25‑Oct‑2024 Paracetamol 500 mg TID No Table 1: Sample EMR fields that can be directly mapped to protocol eligibility. The “Enrollment Flag” column is automatically set by the eligibility rule engine. 6. Recruitment Workflow with EMR Integration Step Activity Owner Input Output Tool Time Saved (days) Risk Compliance Check KPI 1 Pull target cohort list Feasibility Analyst Diagnosis codes, labs Candidate list EMR query builder 7 Data mapping error ICMR consent log % candidates identified 2 Apply protocol filters CRA Candidate list Eligible list Eligibility engine 5 False positives Audit trail Screen‑fail rate 3 Generate patient outreach script Site Coordinator Eligible list Script + contact plan CRM 3 Script inaccuracies SOP adherence Outreach success 4 Contact patient & obtain consent PI/Study Nurse Script Signed consent e‑Consent platform 2 Consent refusal Informed consent form Consent conversion 5 Pre‑screen labs & vitals Lab Manager EMR real‑time data Clearance to enroll LIMS 1 Out‑of‑range labs Lab accreditation Pre‑screen pass 6 Randomize & schedule visit CRO Operations Clearance Randomization ID eTMF/CTMS 0.5 Randomization error CFR 21 Part 11 Enrollment time 7 Document enrollment Site Data Manager Randomization ID eCRF entry eDC system 0.5 Data entry lag GCP inspection Data entry latency Table 2: End‑to‑end recruitment steps when EMR is leveraged. The cumulative time saved

Read more >

Why Participant Retention Matters: Expert Strategies That Reduce Dropout Rates by 40%

SummaryParticipant retention is a fundamental challenge in many research endeavours, from clinical trials and longitudinal surveys to market research studies. High dropout rates can undermine a study’s validity, inflate its costs, delay timelines and—and in some cases—jeopardize ethical compliance. Recent analyses show that carefully designed retention strategies can reduce dropout rates by up to 40 percent, safeguarding scientific integrity and producing more reliable, actionable results. This article examines the consequences of participant attrition, explores proven retention techniques and offers expert guidance tailored for researchers seeking to optimize their study outcomes. Introduction: The Challenge of Participant Dropout Participant dropout is an endemic problem across disciplines. In clinical research, attrition rates frequently exceed 20 percent, while longitudinal social science surveys can lose as much as one-third of respondents over time. Market research panels often experience even higher churn. Regardless of the field, each withdrawn participant represents lost data, diminished statistical power and potentially biased findings. For researchers operating under fixed budgets and tight regulatory or publication deadlines, high attrition can derail projects, necessitate costly expansions or—at worst—force a study’s termination. Consequences of High Dropout Rates Every participant who leaves a study reduces its sample size and shifts its demographic profile. If attrition is non-random, for example, if younger or less affluent subjects are more likely to drop out, results may systematically overrepresent certain groups and distort conclusions. Moreover, reduced sample sizes also compromise statistical power. As a result, it becomes more difficult to detect true effects or differences. For instance, in drug development, underpowered clinical trials can yield inconclusive safety or efficacy signals. Consequently, this may delay regulatory approval. Retaining participants requires resource allocation—staff time, participant reimbursements and communication systems—but these investments pale in comparison to the expense of replacing lost subjects or extending recruitment timelines. A common rule of thumb in clinical research is that recruiting a replacement participant costs roughly 150 percent of the original per-subject recruitment expense. Moreover, every month of delay can magnify overhead costs, lengthen time-to-market for new treatments and elevate opportunity costs for sponsors. High dropout rates also raise ethical flags. In clinical trials, incomplete follow-up data may leave participants uncertain about the outcomes of interventions to which they have committed. Regulatory agencies increasingly scrutinize retention strategies as part of trial quality assessment, and institutional review boards expect protocols to address attrition risk. Failure to mitigate dropout can therefore constitute an ethical lapse that undermines the social contract between researchers and participants. Strategies to Improve Retention Effective retention begins at enrollment. A clear, thorough informed-consent process sets expectations, clarifies time commitments and fosters participant trust. Experts recommend personalized orientation sessions—either in person or via videoconference—where navigators guide subjects through study procedures, answer questions and assess potential barriers to ongoing participation. Monetary incentives remain a powerful motivator, but their structure matters. Tiered compensations—where incremental payments increase at key milestones—encourage participants to stay through the study’s completion. Non-monetary rewards, such as personalized feedback reports or educational materials, can augment financial incentives and reinforce engagement. Regular, transparent communication keeps participants invested. Automated reminders for appointments, personalized progress updates and newsletters highlighting study developments maintain a sense of community and underscore the value of each contribution. Two-way channels—dedicated helplines or chat functions—enable participants to voice concerns promptly, reducing the likelihood of uncommunicated withdrawals. Studies that prioritize participant convenience tend to retain subjects more effectively. Flexible scheduling windows, options for remote visits or home-based assessments and streamlined data-collection instruments limit the burden on participants. Involving participants in advisory panels during the protocol design phase can identify potential friction points before the study commences. Digital engagement tools—including mobile apps, wearable sensors and web-based portals—offer real-time data collection and interactive features that sustain participant interest. Push notifications can remind subjects of upcoming tasks, while interactive dashboards allow them to track their own progress. In recent multisite studies, integration of remote monitoring reduced dropout rates by up to 40 percent, largely because participants could fulfill obligations from home, at times that suited their schedules. Retention is a team effort. Investing in comprehensive training for coordinators, interviewers and fieldworkers ensures consistent participant experiences across sites. Staff who master effective communication techniques, cultural competency and problem-solving protocols can identify early warning signs of disengagement and deploy remedial measures—such as additional check-ins or personalized outreach. Ongoing evaluation of retention data enables dynamic adjustments. A simple attrition dashboard—tracking dropout rates by site, demographic subgroup and visit type—can reveal emerging trends. If particular cohorts display higher withdrawal rates, adaptive interventions (such as targeted outreach, additional incentives or simplified procedures) can be implemented immediately, rather than waiting for a protocol amendment Participant Retention Clinical Trials. Case Studies Demonstrating 40% Improvement Clinical Trial with Digital Engagement Platform. A Phase II pharmaceutical trial in immunology enrolled 600 participants across eight centers. Traditional retention efforts resulted in a 25 percent dropout rate after six months. Mid-study, the sponsor introduced a bespoke mobile app featuring scheduled reminders, interactive educational modules and a direct messaging function with study coordinators. Within three months, dropout stabilized at 15 percent—a relative reduction of 40 percent—while participant satisfaction scores rose from 68 percent to 85 percent. Longitudinal Social Survey Using Flexible Scheduling A national longitudinal study of household consumption patterns experienced a 30 percent attrition at the 12-month follow-up. Researchers restructured their approach: they extended interview windows from two to six weeks, offered weekend and evening slots and supplemented telephone interviews with web-based self-completion options. Attrition at the subsequent follow-up fell to 18 percent, representing a 40 percent reduction in dropouts and enhancing representativeness across socioeconomic strata. Implementation Guidelines and Best Practices Measuring and Monitoring Retention MetricsKey performance indicators (KPIs) for retention include completion rates per visit, time to dropout, reasons for withdrawal and demographic patterns of attrition. Advanced analytics—such as survival analysis or multivariate logistic regression—can identify predictors of dropout, facilitating targeted interventions. Benchmarking these KPIs against industry standards or previous studies informs continuous improvement and underpins funder and regulatory reporting requirements Participant Retention Clinical Trials. Expert Recommendations and Future Directions Emerging research underscores the importance of

Read more >
Patient Recruitment India Importance

The Importance of Timely and Cost-Effective Patient Recruitment in India

Patient Recruitment India Importance. India has become a pivotal player in the global clinical trial landscape, offering a vast and diverse patient population, competitive operational costs, and an expanding regulatory framework. With over 1,800 active clinical trial sites, the country has demonstrated strong capabilities in accelerating late-phase trials and post-marketing studies. However, ensuring timely and cost-effective patient recruitment remains a complex challenge that sponsors must navigate strategically. The Indian clinical trial ecosystem is characterized by its potential to deliver high patient throughput, but this potential is often hindered by operational inefficiencies. Fragmented site readiness, inconsistent data quality, and delayed recruitment processes can lead to extended timelines and budget overruns. Patient Recruitment India Importance For sponsors, the implications are clear: without a well-structured, localized recruitment strategy, clinical studies are at risk of missing milestones, compromising regulatory compliance, and reducing the overall return on investment. This blog provides a comprehensive, execution-focused overview of the 10 most pressing recruitment-related challenges in India and presents actionable, data-backed solutions. From infrastructure gaps to site performance variability, each challenge is examined with a pragmatic lens, offering insights derived from real-world experience in the field. Additionally, the role of a capable execution partner, such as Oxygen Clinical Research and Services, is explored in detail, highlighting how localized expertise can bridge critical gaps in patient recruitment. By addressing these challenges strategically, sponsors can optimize timelines, strengthen compliance, and maximize the value of their clinical programs in one of the world’s most dynamic trial markets. 10 Real-World Patient Recruitment Challenges in India Despite India’s strong clinical trial infrastructure, patient recruitment remains a persistent challenge due to operational inefficiencies, site variability, and systemic constraints. One of the most significant pain points is the issue of site readiness. A 2023 report from a leading CRO revealed that nearly 38% of sites across India struggle with recruitment due to inadequate screening processes, incomplete databases, and limited awareness of trial eligibility criteria. This often results in missed enrollment windows, leading to delays in study timelines and increased costs. Another major challenge is the inconsistency in data quality. Inconsistent documentation, poor data capture, and lack of standardized processes across centers can compromise data integrity. For instance, a cross-sectional analysis of site performance in 2022 found that 25% of sites exhibited gaps in source documentation, which directly affects regulatory compliance and audit readiness. Furthermore, participant retention is a critical concern, with around 28% of enrolled patients failing to complete study visits or discontinuing participation due to logistical or motivational barriers. One of the most underappreciated yet impactful challenges is the variability in site performance. While some sites consistently meet enrollment targets, others suffer from recruitment bottlenecks due to infrastructure limitations, staff turnover, or inefficiencies in coordination with principal investigators. In a 2024 feasibility assessment, 15% of sites evaluated were found to be underperforming due to a lack of streamlined communication and training. In the next section, we will explore actionable strategies to address these issues effectively. Strategies for Overcoming Recruitment Challenges in India To address the operational pain points in patient recruitment, sponsors must adopt a structured, data-driven approach that prioritizes site readiness, standardized processes, and continuous monitoring. One effective strategy is the implementation of proactive feasibility assessments, which allow sponsors to identify high-performing sites based on enrollment history, patient demographics, and investigator experience. According to an internal review by a leading CRO, sites with documented recruitment success in the past three years were 40% more likely to meet enrollment targets, reducing startup timelines by an average of 20%. Standardizing data collection and documentation practices is another critical step in ensuring data quality. By implementing centralized training programs for site staff on electronic data capture (EDC) systems and Good Clinical Practice (GCP) guidelines, sponsors can reduce data discrepancies. A 2023 audit of sites with trained personnel revealed an 83% improvement in documentation compliance compared to untrained sites. To enhance site performance, a hybrid recruitment model—combining local investigator engagement with centralized screening support—can help bridge gaps in patient identification and follow-up. Additionally, integrating digital tools such as SMS reminders and mobile data collection platforms improves patient retention. A 2024 study found that sites using digital follow-up tools reported a 30% faster identification of potential candidates and a 22% increase in retention rates. In the next section, we will explore how Oxygen Clinical Research and Services plays a pivotal role in executing these strategies effectively. Oxygen Clinical Research and Services: A partner in recruitment excellence Oxygen Clinical Research and Services has established itself as a key player in addressing the complex landscape of clinical trial recruitment in India through its strategic implementation of hybrid models and innovative digital tools. Leveraging a comprehensive understanding of local challenges, Oxygen has created a scalable framework that streamlines patient identification and follow-up processes. By integrating digital follow-up tools, such as SMS reminders and mobile data collection platforms, Oxygen significantly enhances patient retention rates. For instance, the organization reported a 30% improvement in the speed of candidate identification and a 22% boost in retention, directly attributing these outcomes to their digital strategies. Furthermore, Oxygen has adopted a hybrid recruitment model that combines the strengths of local investigator engagement with centralized screening support. This approach allows for more targeted and efficient patient recruitment, enabling the organization to meet enrollment targets consistently. Through its proactive feasibility assessments, Oxygen identifies high-performing sites, resulting in a 40% increase in successful site selection and reducing startup timelines by 20%. Their commitment to training and upskilling site staff has led to an 83% improvement in documentation compliance, reinforcing data quality and regulatory compliance. By effectively addressing the systemic recruitment challenges, Oxygen Clinical Research and Services not only enhances performance metrics but also contributes to the successful execution of clinical trials in India, ultimately facilitating better health outcomes for patients. Case Studies: Transforming Recruitment Challenges into Operational Excellence Oxygen Clinical Research and Services has demonstrated its ability to overcome recruitment bottlenecks through strategic implementation of hybrid and digital tools, as evidenced by recent case studies. In a phase

Read more >

What makes a trial site “high-performing”? and why site performance impacts timelines, and cost?

High Performing Clinical Trial. Typically, when selecting trial sites, sponsors and CROs rely on historical enrollment data, investigator reputation, or KOL status. While these factors are important, they are often insufficient predictors of actual study performance. In practice, I have observed that relying solely on such indicators can be misleading. For example, in my 15+ years managing global trials across pharma and biotech, high-enrolling sites have sometimes derailed timelines due to protocol deviations, inconsistent monitoring compliance, and poor data quality. On the other hand, mid-tier sites have often demonstrated exceptional operational stability. In fact, they consistently meet enrollment targets, minimize protocol deviations, and pass audits with minimal findings. As a result, a more balanced and data-driven approach to site selection is essential. Therefore, sponsors should evaluate both quantitative metrics and operational quality indicators to ensure reliable trial execution. click here The difference lies in how performance is defined. A high-performing site isn’t one that enrolls fastest. It’s one that delivers predictable execution: consistent data capture, reliable source documentation, compliance with Good Clinical Practice (GCP), and low screen-fail ratios. These attributes directly impact cost and timeline predictability. These are not incremental efficiencies—they compound across multi-site trials and translate into 12–18% faster study execution and 10–15% cost savings in start-up and monitoring spend. This article breaks down the operational metrics that separate high-performing sites from the rest, based on real-world execution across 40+ trials in India and globally. You’ll find comparative data, actionable checklists, and hard lessons from trials where site selection made or broke delivery. Defining a High-Performing Site: Beyond Enrollment Numbers Enrollment velocity is the most cited metric in site evaluation. However, in practice, it is the least reliable as a standalone KPI. This is because sites that rapidly screen patients may also have high screen-fail ratios due to overly aggressive recruitment tactics or inadequate pre-screening. Moreover, such approaches can compromise overall efficiency. On the other hand, some sites may meet enrollment targets but still generate protocol deviations. As a result, these deviations can cascade into data queries, monitoring delays, or even site-specific holds. Therefore, relying solely on a single KPI can lead to misleading performance assessments. True site performance is multi-dimensional. It spans four operational pillars: Below is a comparison of site performance across these dimensions using anonymized data from Phase 2–3 oncology, metabolic, and rare disease trials in India (n = 68 sites, 2018–2023). Key Operational Metrics That Matter to Sponsors Let’s break down each performance dimension with real-world operational insights. 1. Enrollment Efficiency: It’s Not Just Volume High volume ≠ high efficiency. A site screening 50 patients/month sounds impressive—until you learn that 35 fail eligibility. That’s 35 patients consuming lab resources, investigator time, and CRA oversight, only to yield 15 randomized subjects. Efficiency is measured by: 2. Data Quality: The Hidden Time Sink Poor data quality delays database locks, increases monitoring costs, and raises query volumes. Sponsors often treat data issues as CRA responsibilities. However, root causes are typically site-level. In most cases, these issues originate from operational inefficiencies or resource limitations within the site. For example, gaps in staff training, patient management, or protocol adherence can significantly impact performance. As a result, site-specific challenges often drive overall trial delays and quality concerns. Therefore, identifying and addressing these root causes at the site level is essential for sustainable improvement. Top sites implement: 3. Protocol Compliance: The Audit Risk Multiplier Protocol deviations aren’t just data quality issues—they’re regulatory exposure. A single major deviation can trigger a site-specific clinical hold. CDSCO and FDA inspections focus heavily on deviation trends and corrective actions. High-performing sites: 4. Operational Resilience: The Unseen Enabler However, a site may have strong metrics today but still collapse under pressure. This is because underlying risks are not always visible in surface-level performance data. For example, operational bottlenecks, staff limitations, or poor patient retention strategies can weaken performance over time. As a result, even high-performing sites may struggle to sustain outcomes under increased workload. Therefore, it is essential to evaluate deeper operational factors rather than relying solely on current metrics. Resilience is measured by: Practical Checklist: Evaluating Site Resilience During Feasibility Challenges in Identifying High-Performing Sites – And How to Mitigate Them Even with clear metrics, sponsors face operational roadblocks. Below are common challenges and mitigation strategies—no sugar coating. Challenge 1: Feasibility Data is Often Inflated Sites routinely overestimate capacity during feasibility. A site claiming “10 patients/month” may base this on historical averages across unrelated indications High Performing Clinical Trial. Mitigation: Challenge 2: Local SMOs Lack Oversight Rigor Many SMOs in India provide site access but don’t enforce standardized processes. Site performance varies widely even within the same SMO network. Mitigation: Challenge 3: Ethics Committee Delays Cascade into Timelines EC approval in India averages 45–60 days. Some sites have ECs that meet monthly—causing 30-day delays per submission. Mitigation: Challenge 4: Patient Follow-Up Breaks in Chronic Studies In long-term trials, such as those for diabetes and rare diseases, subject retention often declines after Year 1. This is because prolonged participation can lead to fatigue and reduced patient motivation. Moreover, ongoing visit requirements and treatment burdens further contribute to dropout. As a result, retention becomes a growing challenge over time. Therefore, implementing proactive engagement and follow-up strategies is essential to sustain participation. Sites without patient engagement protocols lose 30–40% of subjects High Performing Clinical Trial. Mitigation: The Role of the SMO: Why Partnership Depth Matters Not all SMOs are equal. However, many organizations function primarily as site brokers, providing access without maintaining operational control. As a result, consistency in trial execution can be compromised. Moreover, the lack of direct oversight may lead to variability in performance across sites. Therefore, relying solely on such models can introduce risks in quality and compliance. The best SMOs act as extension of the sponsor’s clinical operations team, enforcing compliance, standardizing processes, and resolving issues pre-escalation. For example, Oxygen Clinical Research and Services operates with a centralized quality management system (QMS) that audits sites monthly, standardizes recruitment SOPs, and provides real-time dashboards to

Read more >
Navigating Ethics Committee Delays

The Unseen Anchor: Navigating Ethics Committee Delays in Indian Clinical Trials

Navigating Ethics Committee Delays For any clinical operations leader who has spent more than a week on the ground in India, the term “EC approval” evokes a specific, familiar feeling. It’s a mix of respect for the process and a quiet anxiety about the timeline. In a country that has solidified its position as a global clinical research hub, the Ethics Committee (EC) remains one of the most critical, yet unpredictable, gatekeepers. A delay here doesn’t just push your site initiation visit (SIV) by a few weeks; it cascades, impacting patient enrolment, locking up resources, and burning budget. This isn’t theoretical. I’ve seen multi-centre trials where a two-month EC delay at a key site effectively derailed the entire enrolment strategy for a quarter. After 15 years of executing trials across India for sponsors and CROs, from early-phase biotech studies to large Phase III multinational programs, I’ve identified that most EC delays are not mysteries. They are predictable and, more importantly, preventable. This article breaks down the common causes from an operational perspective and provides a tactical playbook for sites and sponsors to prevent them. The Core Role of an Ethics Committee in India Before we diagnose the delays, we must understand the EC’s mandate. In India, an EC registered with the Central Drugs Standard Control Organisation (CDSCO) is not just a reviewer; it is the guardian of participant rights, safety, and wellbeing. Its responsibilities, as per the New Drugs and Clinical Trials Rules, 2019, are extensive and legally binding. They review the scientific rationale, but their primary lens is ethical and contextual—weighing the risk-benefit ratio for the Indian population specifically. A common sponsor mistake is viewing the EC as a bureaucratic hurdle to be cleared rather than a scientific and ethical partner. This mindset is the first step toward delay. A well-prepared submission that respects this role is already halfway to a swift approval. Common Causes of Ethics Committee Delays: A Root Cause Analysis Based on lived experience, these are the categories where submissions most frequently stall. 1. Incomplete or Incorrect Submission Dossier This is the most frequent and easily avoidable cause. An EC’s SOPs will have a precise checklist. Deviating from it is an instant trigger for a “query” or outright return of the application. What fails: The classic error is assuming that what worked for the US IRB or a European EC will work in India. Key differences include: Common ICF Shortcomings Leading to EC Queries Shortcoming Operational Reality Complex Language Using English at a >12th-grade reading level for a population where regional language understanding is key. Incomplete Risk Section Downplaying known risks or omitting standard-of-care treatment options. Incorrect Compensation Language Vague terms for travel compensation. It must be specific: “X rupees per visit” for travel, not a lump sum. Missing Mandatory Clauses Omitting clauses related to data access, biological sample usage, and compensation for trial-related injury. 2. Lack of Site Preparedness and PI Engagement The Principal Investigator (PI) is the face of the study to the EC. Their engagement is non-negotiable. What fails: The PI is too busy and delegates the entire EC submission process to a junior coordinator who lacks the authority or deep therapeutic knowledge to answer EC questions effectively. When the EC has a complex scientific question about the protocol, they need the PI’s answer, not the CRA’s Navigating Ethics Committee Delays. The reality: A proactive PI who has reviewed the protocol in depth, understands the nuances of the ICF, and is prepared to personally attend the EC meeting (if invited) is a massive accelerant. Sites that treat the EC submission as a collaborative effort between the PI, coordinator, and sponsor team see dramatically faster turnarounds. 3. Protocol and ICF Complexity ECs in India are particularly vigilant about overly complex protocols and the practical burden they place on participants. What fails: A protocol with an excessive number of blood draws, cumbersome diary entries, or frequent long-duration visits will be scrutinized heavily. The EC will ask: “Is this burden justified for our participants?” If the answer isn’t clear, they will send it back for justification or simplification. The mitigation: During feasibility, discuss protocol design with sites. A site’s feedback on participant burden is gold dust. A small protocol amendment proposed by the site PI during feasibility can prevent a major EC query later. 4. Operational Inefficiency of the EC Itself We must be realistic. Sometimes the delay is not on the sponsor or site side. ECs are composed of volunteers—busy doctors, lawyers, and community members. They meet monthly or quarterly. Understanding EC Operational Timelines EC Factor Impact on Timeline Meeting Frequency Monthly meetings are standard; if you miss the deadline, it’s a 4-5 week wait just for review. Member Availability Lack of quorum is a common, frustrating reason for last-minute meeting cancellations. Sop Maturity A new or recently reconstituted EC may have slower, more meticulous processes. Therapeutic Area Complexity Studies with novel gene therapies or complex risk profiles may require external expert review, adding weeks. The myth vs. reality: A common sponsor myth is that all EC delays are the site’s fault. The reality is that the EC’s internal workflow is a variable entirely outside the site’s or sponsor’s direct control. Your job is to not give them any reason to delay it further. The Proactive Playbook: How Sites and Sponsors Can Prevent Delays Prevention is always faster than cure. Here is a tactical checklist. click here For Sites (SMOs & PIs): For Sponsors & CROs (Feasibility & Operations): Question to Ask potential Sites What the Answer Tells You “Can you share a recent EC meeting schedule and submission deadline calendar?” Assesses planning predictability. “Can you provide a copy of your current EC submission checklist?” Allows you to prepare the dossier perfectly. “Who is the EC Chair and what is their therapeutic background?” Helps anticipate the type of scientific questions you may get. “What has been your longest EC delay in the past year and what caused it?” Reveals operational honesty and historical pain

Read more >

ready to take your business to the next level?

Get in touch today and receive a complimentary consultation.

Scroll to Top