Understanding
1. Introduction – Why Recruitment Forecasting Matters Clinical Recruitment Potential India click here
Based on experience, in more than fifteen years of running Phase I–IV trials across Mumbai, Bengaluru, Hyderabad, and tier-2 cities, recruitment estimates have fluctuated significantly. In fact, actual enrollment has ranged from +30% above projections to as low as −50% below the original target. Therefore, relying solely on initial estimates without data validation can lead to major feasibility risks. The variance is rarely a statistical artifact; it is the result of how a site quantifies its patient pool, validates the data, and translates the numbers into a realistic enrollment plan (Clinical Recruitment Potential India).
The purpose of this article is to walk sponsors, CROs, feasibility teams, and site managers through the exact steps a site in India takes to calculate patient recruitment potential. Importantly, the focus is on four critical pillars: speed, predictability, compliance, and data quality. Together, these elements protect trial timelines and budgets. Moreover, they ensure that regulatory expectations are consistently met while maintaining the highest standards of study integrity (Clinical Recruitment Potential India).
Core Elements of a Recruitment Potential Model Understanding recruitment potential requires a structured and data-driven approach.Therefore, clinical trial sites must evaluate multiple variables that directly influence patient enrollment speed and overall feasibility. In addition, combining historical data with real-world insights enables the development of a more accurate and reliable recruitment forecast. As a result, sponsors can make better-informed decisions and minimize the risk of enrollment delays (Clinical Recruitment Potential India).
| Sr.No. | Element | Data Source | Frequency of Update | Typical Turn‑Around (days) | Validation Method | Compliance Checkpoint | Key Metric | Risk if Ignored | Mitigation |
| 1 | Disease Prevalence in Catchment Area | ICMR epidemiology reports, Hospital EMR | Annually | 7 | Cross‑reference with national registries | CDSCO data‑privacy audit | Prevalence × Population | Over‑estimation of pool | Adjust with local physician surveys |
| 2 | Site‑Specific Patient Database | Site EMR, OPD registers, Lab info system | Monthly | 5 | Duplicate removal, de‑identification | SOP‑001 (Data Handling) | Unique Eligible Patients | Duplicate counts inflate numbers | Run SQL dedup scripts |
| 3 | Referral Network Strength | Referral agreements, KOL outreach logs | Quarterly | 10 | Referral conversion rate analysis | Ethical Committee approval | Referral‑to‑Screen Ratio | Weak network stalls enrolment | Activate digital referral portals |
| 4 | Eligibility Filter Compliance | Protocol inclusion/exclusion matrix | Per protocol amendment | 2 | Manual chart pull + algorithmic screening | Sponsor QA sign‑off | Screen‑Fail Rate | High screen‑fail delays site start | Early feasibility run‑in |
| 5 | Patient Accessibility Index | Transport maps, socio‑economic data | Bi‑annual | 3 | GIS mapping, travel time simulation | Site IRB review | Avg. travel time < 60 min | Poor access reduces consent | Provide travel stipend, satellite sites |
| 6 | Historical Enrollment Performance | Past trial data (last 5 years) | After each study | 14 | Trend analysis, regression | CRO performance audit | Enrollment‑per‑Month | Ignoring trends repeats past bottlenecks | Benchmark against similar therapeutic area |
| 7 | Investigator Engagement Score | PI meeting minutes, KPI dashboards | Monthly | 2 | Scoring rubric (0‑5) | Sponsor‑site contract | PI Commitment Level | Low engagement leads to dropout | Incentive‑based enrolment targets |
| 8 | Site Infrastructure Capacity | Bed count, ICU, imaging slots | Quarterly | 4 | Capacity utilisation report | GCP compliance checklist | Max Patients per Week | Over‑booking compromises data quality | Staggered enrolment windows |
| 9 | Regulatory Timeline Buffer | DCGI/CSIR approvals, ethics clearance | Per study | 1 | Gantt‑chart tracking | CDSCO review log | Buffer Days | Missing buffer adds unforeseen delays | Add 15 % contingency to each milestone |
| 10 | Patient Retention Forecast | Follow‑up compliance logs | Ongoing | 1 | Kaplan‑Meier analysis | Sponsor DMC review | Expected Drop‑out % | High attrition erodes power | Implement patient‑centric follow‑up plan |
Table 1 – Comprehensive recruitment model components used by high‑performing Indian sites.
3. Step‑by‑Step Calculation Workflow
3.1 Define the Catchment Geography
- Map the radius – Most sites use a 50 km radius for tier‑1 cities, 30 km for tier‑2.
- Overlay disease prevalence – Pull the latest ICMR disease‑specific prevalence rates and apply them to the census data of the catchment area.
- Additionally, adjust for the urban–rural mix when estimating recruitment potential. In general, rural populations tend to have lower healthcare-seeking behavior. Therefore, apply a correction factor of 0.6, unless local surveys or real-world data suggest otherwise. As a result, this adjustment helps create more realistic and reliable recruitment forecasts.
3.2 Extract the Site‑Specific Patient Pool
Practical tip: Use the site’s EMR export function to pull every patient with the ICD‑10 code matching the disease. Clean the list with a de‑duplication script (SQL SELECT DISTINCT).
Result: Raw eligible patient count (A).
3.3 Apply Protocol‑Specific Filters
| Filter | Example | Impact on Count |
| Age range | 18‑65 yr | Reduce A by 12 % |
| Laboratory value | ALT < 2 × ULN | Reduce A by 8 % |
| Co‑morbidities | Exclude uncontrolled diabetes | Reduce A by 5 % |
| Prior therapy | No biologic exposure in last 6 months | Reduce A by 7 % |
Sum of reductions yields Adjusted Eligible Patients (B).
3.4 Factor in Referral and Conversion Rates
Historical conversion of referrals to screened patients in India averages 0.35 – 0.45. Multiply B by the site’s specific conversion factor (C).
Screenable patients = B × C
3.5 Incorporate Operational Capacity
Determine the maximum number of patients that can be processed per month based on:
- Available clinic slots
- Lab turnaround time
- Monitoring bandwidth
For example, if the recruitment capacity is 12 patients per month and the study duration is 9 months, then the maximum enrollable patients (D) equals 108. Therefore, accurately estimating monthly capacity is essential for setting realistic enrollment targets. As a result, it prevents overcommitment and ensures smoother trial execution. Ultimately, this leads to better timeline adherence and improved study outcomes.
3.6 Apply a Real‑World Buffer
Add a 10 % buffer for unexpected screen‑fails, regulatory hold, or pandemic‑related disruptions.
Final Recruitment Potential = min(Screenable patients, D) × 1.10
4. Practical Checklists
4.1 Data Collection Checklist
- Obtain latest ICMR prevalence data per disease.
- Export site EMR with ICD‑10 filters.
- Run de‑duplication script; verify unique patient IDs.
- Cross‑check lab values against protocol thresholds.
- Document referral sources and historical conversion rates.
- Update capacity matrix (clinic, imaging, lab).
- Record regulatory milestones with buffer days.
4.2 Validation Checklist
- Perform spot‑check of 5 % of EMR records manually.
- Re‑run prevalence calculation with alternative source (e.g., WHO).
- Conduct a mini‑audit of referral logs for completeness.
- Review capacity utilization with CRO monitoring team.
- Obtain PI sign‑off on the final recruitment estimate.
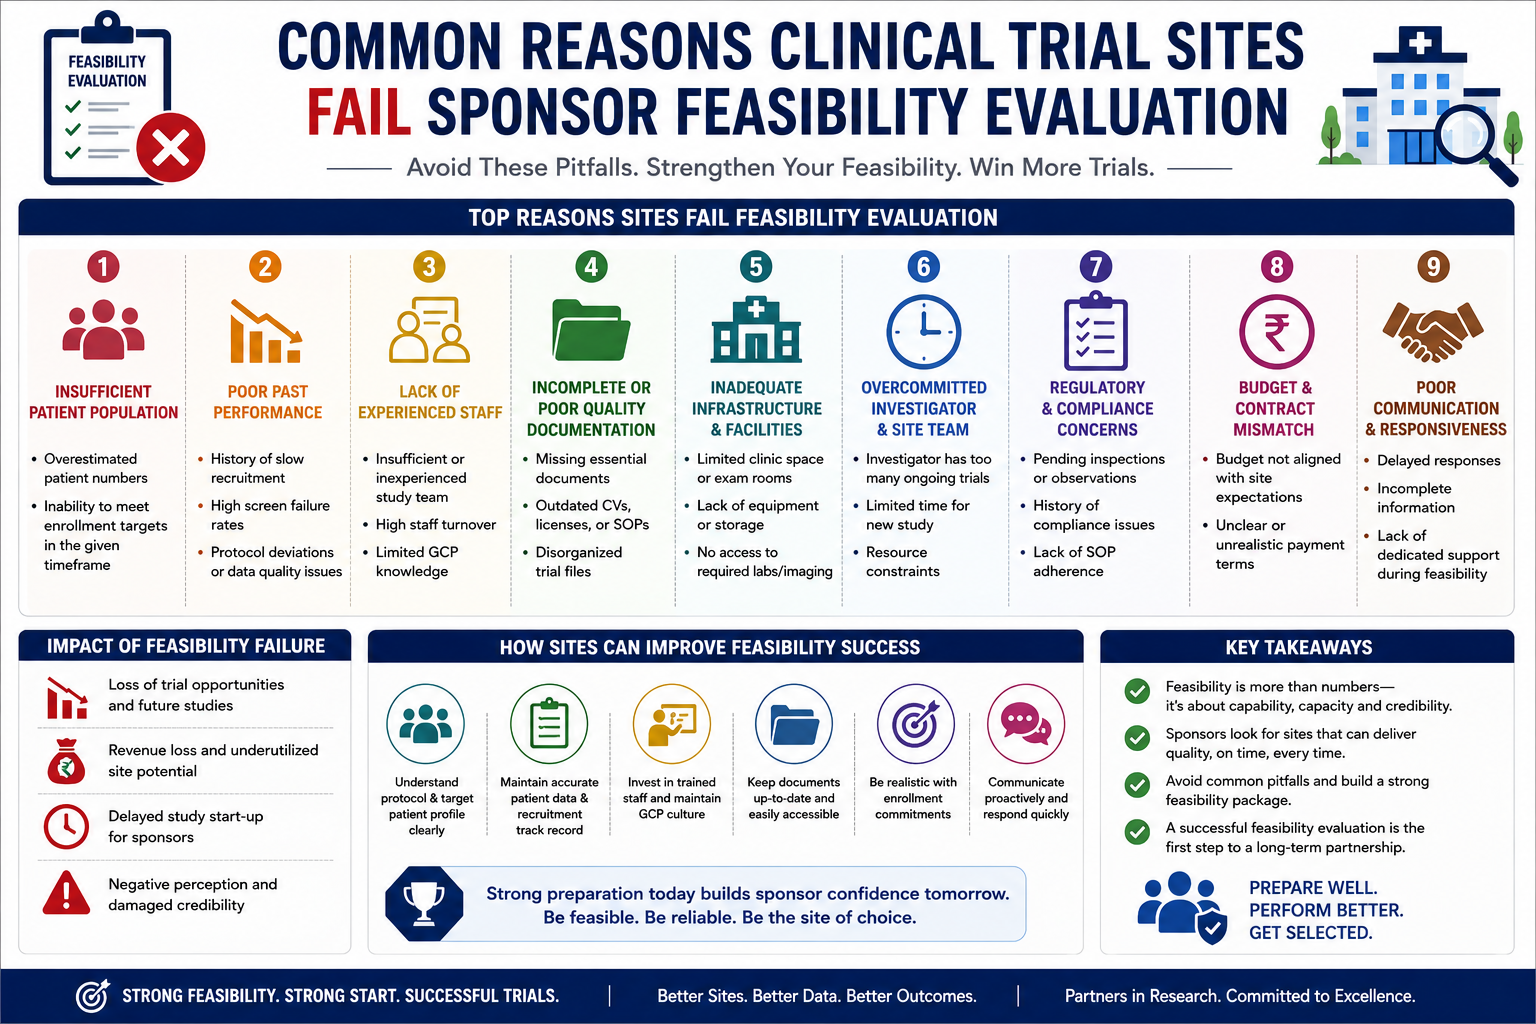
5. Common Mistakes and How to Avoid Them
| Stakeholder | Typical Mistake | Why It Happens | Mitigation |
| Sponsor | Accepts site estimate without independent verification | Time pressure, trust in CRO | Require a second‑level feasibility audit using site‑provided raw data |
| CRO | Uses only disease prevalence, ignoring local access barriers | Focus on macro data | Add GIS travel‑time analysis to the model |
| PI | Over‑states referral network strength | Desire to look proactive | Validate with actual referral conversion numbers from the past 12 months |
| Patient | Assumes trial visits are free of indirect costs | Lack of awareness | Provide transparent stipend policies and transport support |
| Site Manager | Leaves eligibility filters to sponsor after site start | Misunderstanding of SOP‑012 | Conduct pre‑site‑start eligibility workshops |
6. Myths vs Reality
| Myth | Reality |
| “India’s patient pool is unlimited because of population size.” | Only a fraction (~2‑3 %) meet disease‑specific, protocol‑driven eligibility. |
| “High prevalence guarantees fast enrolment.” | Socio‑economic factors, health‑seeking behavior, and physician awareness are equally decisive. |
| “Once a site signs a contract, recruitment is set.” | Ongoing data refreshes and capacity re‑assessment are mandatory throughout the study. |
| “Electronic health records eliminate manual screening.” | Most Indian sites still rely on hybrid paper‑EMR systems; data quality varies widely. |
| “Travel stipends are a regulatory requirement.” | Stipends improve enrollment but are not mandated; they must be disclosed to the Ethics Committee. |
7. Challenges and Mitigation Strategies
7.1 Inconsistent EMR Standards
Challenge: Different sites use varying data codings (ICD‑9 vs ICD‑10, custom codes).
Mitigation: Deploy a data-mapping tool that translates local codes into a common ontology before analysis. This ensures standardized data interpretation across sites. Moreover, it improves consistency and comparability of datasets. As a result, recruitment forecasts become more accurate and reliable. Provide training to site data managers on standardised extraction.
7.2 Low Referral Conversion in Tier‑2 Cities
Challenge: Physicians reluctant to refer due to lack of trial awareness.
Mitigation: Conduct quarterly KOL webinars, distribute trial‑specific brochures, and set up a site‑owned digital referral portal with real‑time status updates.
7.3 Regulatory Delays During Ethics Review
Challenge: Ethics committees may request additional documentation, extending timelines by 30‑45 days.
Mitigation: Pre‑populate the IEC submission pack using a templated checklist, and schedule an advance pre‑submission meeting with the IEC chair.
7.4 Patient Attrition Post‑Screening
However, dropout rates of 20–30% are quite common in clinical trials. This is primarily because patients often face travel burdens or develop concerns about potential side effects. As a result, retention becomes a critical challenge that directly impacts trial timelines and data completeness.
Mitigation: Implement a patient‑centric retention plan—tele‑consultations, home‑sample collection, and a 24 h helpline. Track retention metrics weekly.
7.5 Data Quality Issues in Real‑World Evidence
Challenge: Missing lab values or incomplete follow‑up forms lead to data queries.
Mitigation: Use an electronic CRF with mandatory field validation and a real‑time query dashboard that flags missing data to the site monitor instantly.
8. Frequently Asked Questions
Q1: How often should a site refresh its prevalence data?
A: At minimum annually, but when a new ICMR or WHO report is released, update immediately to capture emerging trends.
Q2: Can a site rely solely on historical enrollment numbers?
A: No. Historical performance provides a baseline, but each protocol’s inclusion criteria and therapeutic area can shift the pool dramatically.
Q3: What is a realistic conversion factor for referrals in India?
A: Nationwide averages sit between 0.35 and 0.45, though tier‑1 sites with strong KOL networks can achieve up to 0.55.
Q4: How do you account for patients lost to follow‑up?
A: Apply an attrition factor of 20 % for Phase III oncology studies and 10 % for chronic disease trials; adjust based on site‑specific retention data.
Q5: Is a 10 % buffer sufficient for unforeseen events?
A: It works for routine screen‑fails. Additionally, for high-risk scenarios such as pandemics or regulatory holds, the buffer should be increased to 15–20%. This is because such situations can significantly disrupt recruitment timelines and site operations. Therefore, applying a higher buffer helps maintain realistic projections. As a result, it reduces the risk of unexpected delays and improves overall study planning.
Q6: Should the sponsor request the raw EMR extract?
A: Yes, as part of the feasibility audit. Ensure the extract is de‑identified per CDSCO data‑privacy guidelines.
Q7: How do transport stipends affect recruitment numbers?
A: In tier‑2 and tier‑3 cities, offering a modest stipend (₹ 500‑₹ 800 per visit) can improve consent rates by 12‑18 %.
Q8: What role does GIS mapping play in recruitment planning?
A: It quantifies patient accessibility, helping to set realistic travel‑time thresholds and identify satellite clinic locations.
Q9: Can digital patient recruitment platforms replace traditional referrals?
A: In practice, they supplement but do not replace physician referrals in India. This is because physician trust remains the dominant driver for patient enrolment. Therefore, digital or alternative strategies should be used alongside strong physician engagement rather than as a substitute.
Q10: Who owns the final recruitment potential number?
A: Finally, the site’s Feasibility Lead, in collaboration with the Principal Investigator (PI), signs off on the recruitment estimate. Subsequently, the sponsor reviews and validates this estimate before finalizing the study budget. As a result, this process ensures alignment between site capacity and sponsor expectations.
9. Actionable Conclusion
Accurately calculating patient recruitment potential in India is a disciplined exercise that blends epidemiology, site‑level data hygiene, operational capacity analysis, and continuous risk buffering. The model must be revisited at every protocol amendment and whenever a new data source becomes available (Clinical Recruitment Potential India).
By applying the structured workflow, checklists, and mitigation tactics outlined above, sponsors and CROs can shift from guess‑work to predictability, thereby protecting timelines, budgets, and data integrity.
Importantly, the most reliable recruitment forecast comes from a site that treats its patient database as a living asset. In addition, it rigorously validates every filter against the study protocol. Moreover, it ensures that all criteria are consistently aligned with study requirements. Furthermore, it clearly quantifies capacity limits before committing to enrollment targets. As a result, this structured approach enhances feasibility accuracy and accelerates recruitment. Consequently, it significantly reduces the risk of overcommitment. Ultimately, this leads to more predictable and efficient trial execution. Ultimately, it leads to more predictable and efficient trial execution (Clinical Recruitment Potential India).
For further discussions on site selection, patient retention, or to request a feasibility audit from a proven partner, contact Govind Pawar at govindpawar@oxygenclinicaltrials.com or visit oxygenclinicaltrial.com. Connect on LinkedIn at www.linkedin.com/in/govind-pawar-42518511a.
10. Suggested Internal Links
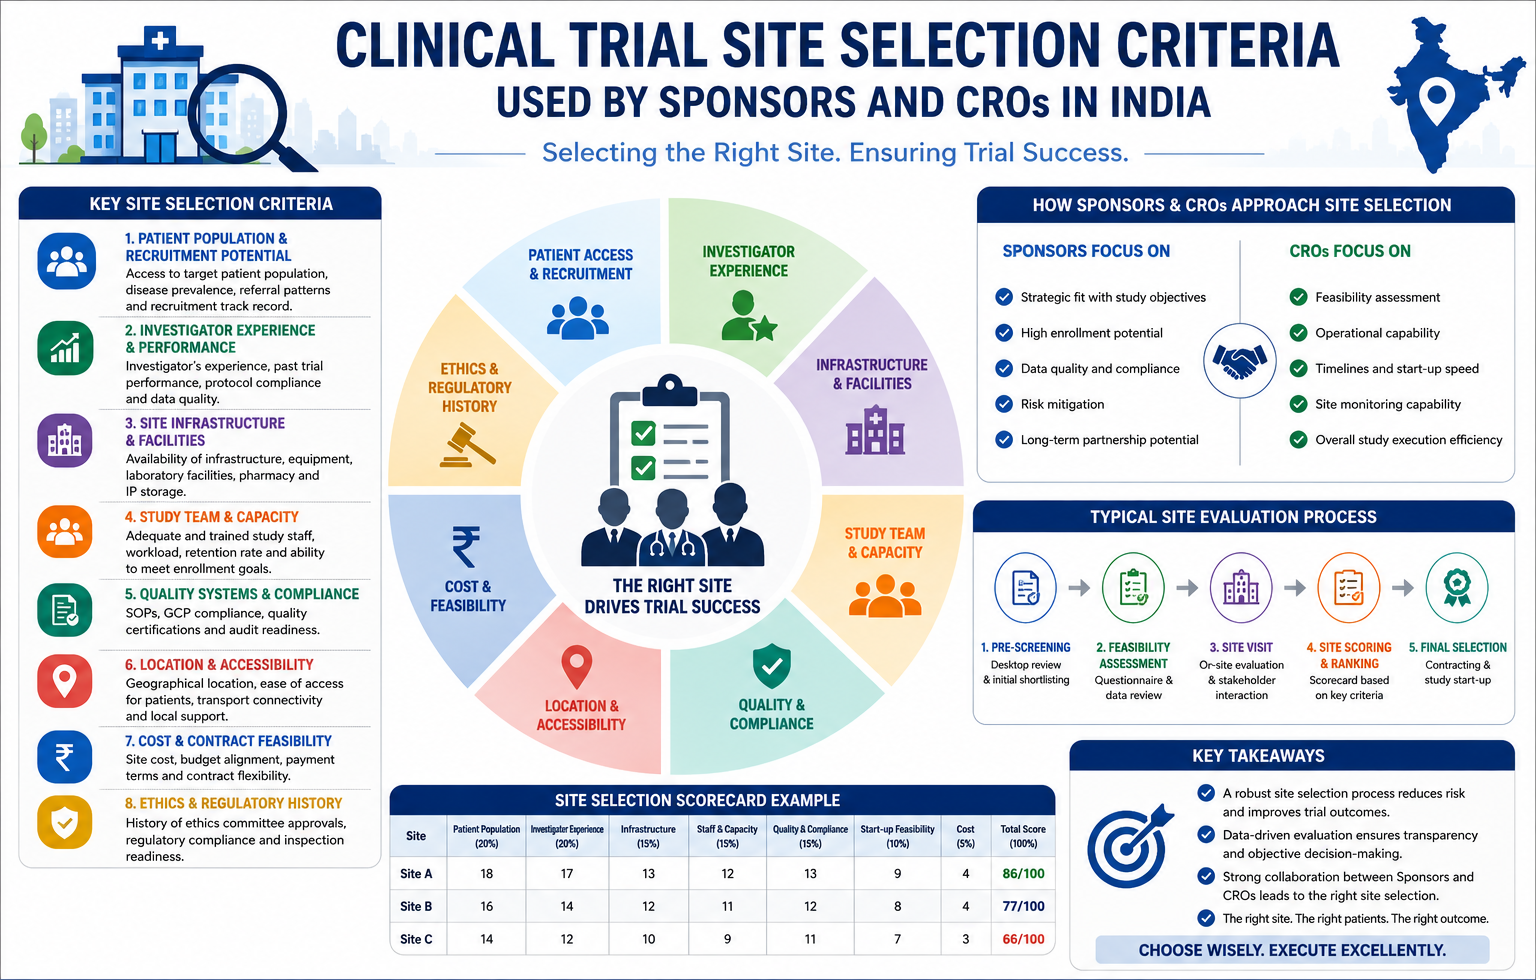
- Site Selection Strategies for Multicenter Trials in India – a deep‑dive into geographic and therapeutic considerations.
- Optimising Patient Retention: Practical Tools for Indian Sites – case studies on travel stipends and tele‑monitoring.
- Regulatory Compliance Checklist for Clinical Trials in India – a step‑by‑step guide aligned with CDSCO and ICMR requirements.
11. Suggested External References
- Central Drugs Standard Control Organization (CDSCO) – Guidelines on Clinical Trial Data Management.
- Indian Council of Medical Research (ICMR) – Latest Disease Prevalence Reports.
- World Health Organization (WHO) – Global Health Estimates (2023).