Why Site Selection Determines Timelines and Cost?Investigator Site Selection Clinicaltrials. In clinical development, every day of trial delay costs $600,000 to $8 million in lost revenue, depending on the asset class. The single largest contributor to recruitment delays more than protocol complexity or regulatory bottlenecks is poor site selection. Sponsors who rush into site activation without a structured, multi-dimensional feasibility assessment end up reacting to cascading delays: under-enrolled sites, data quality issues, protocol deviations, and ethics committee (EC) rejections due to incomplete documentation. The cost isn’t just time it’s the inability to reassign sites mid-trial and the downstream impact on NDA/BLA filing dates.
India represents a high-potential geos for oncology, metabolic, and infectious disease trials due to its disease burden, physician engagement, and regulatory maturation. But selecting high-performing sites isn’t about population density or investigator fame. It’s about executional readiness, support infrastructure, patient access models, and consistent compliance.
This guide provides a 12-point operational feasibility checklist built from real-world trial launches across 37 protocols and 168 Indian sites focused on predictability, IRB/DCGI responsiveness, and patient flow. It also evaluates the role of Site Management Organizations (SMOs) not as vendors, but as force multipliers that de-risk site activation and sustain recruitment momentum.
If your last Phase 2 trial in India missed its enrollment target by >15%, the root cause wasn’t patient access—it was site feasibility done incorrectly.
The Hidden Role of Site Management Organizations (SMOs) in Trial Success Rates
Site selection is not a one-time activity. It’s a continuous diagnostic process that begins with feasibility and extends through activation, recruitment, and data lock. Yet most sponsors treat it as a form-filling exercise handled by a junior CRO project coordinator. This is where a competent Site Management Organization (SMO) alters the equation. Think of SMOs not as staffing agencies for clinical coordinators, but as executional arms that standardize site readiness. While CROs manage timelines and deliverables, SMOs manage the site engine—the day-to-day operations that keep patients flowing and data clean.
SMOs reduce site activation timelines by 30–45 days on average by:
- Pre-negotiating site budgets and contracts
- Pre-screening patient pools using EMR access
- Maintaining continuous relationships with ECs
- Training site staff on protocol-specific workflows ahead of first patient in (FPI)
A 2023 CDSCO inspection analysis of 54 Indian trial sites revealed that 78% of clinical trial delays originated from site-level operational gaps—staff turnover, incomplete source documentation, and ethics committee (EC) non-compliance—not IRB approval lag. SMOs with structured site support models reduced these gaps by 63% over 12 months (ICMR–NCDR Annual Report, 2023).
“We stopped measuring site success by IRB approval time and started measuring it by first patient in within 30 days of approval. That shift forced us to use SMOs as operational partners—not just coordinators.”
Former Head of Clinical Operations, Global Biotech (Phase 3 Oncology Trial, India, 2022)
The 12-Point Feasibility Checklist: What Sponsors Should Actually Evaluate
Feasibility is not a yes/no question. It’s a scoring model. Below is a field-tested 12-point checklist, ranked by impact on enrollment speed and data quality. Each criterion is weighted based on real-world performance across therapeutic areas and complexity levels.
| Feasibility Factor | Weight | Key Validation Method | Evidence Source |
| 1. Historical Enrollment Credibility | 20% | Actual recruitment vs. projected in past 3 studies | CRO site performance logs, CTRI database |
| 2. IRB/EC Engagement Efficiency | 15% | Days from submission to approval (target: ≤21 days) | EC portal logs, SMO tracking data |
| 3. Patient Access Model | 15% | Confirmed pre-screened pool ≥2× target | Site-driven patient tracking logs |
| 4. Site Staff Stability | 10% | Turnover rate (target: <20% annual) | CVs, staff tenure records |
| 5. SMO Integration Level | 10% | On-site presence, SOP adherence | SMO audit reports, training logs |
| 6. Source Document Completeness | 8% | % source data available at screening | Site monitoring visit reports |
| 7. Protocol Compliance Risk | 8% | Historical SDV findings (per 100 CRFs) | CRO monitoring summaries |
| 8. Lab & Diagnostic Readiness | 5% | On-site capabilities, central lab linkage | Site infrastructure checklist |
| 9. Regulatory Documentation Status | 5% | DCGI/EC submission package completeness | Pre-feasibility document tracker |
| 10. Financial & Contract Readiness | 3% | Template availability, negotiation bandwidth | SMO contract team assessment |
| 11. Investigator Time Commitment | 3% | Weekly patient load, trial portfolio | Investigator time log (self-reported + SMO verified) |
| 12. Geopolitical & Site Access Risk | 3% | Flood zones, power stability, transport access | Site location risk map (SMO-generated) |
Operational Insights: What Works (And What Doesn’t)
What Works: Structured Feasibility Scoring with SMO Data
Sponsors with internal feasibility teams often rely on investigator self-assessment. This is flawed. One sponsor (global Tier 1 pharma) found a 42% overestimation in patient availability when comparing investigator estimates to actual pre-screened pools verified by SMOs.
Fix: Use SMOs to conduct on-site feasibility visits with documented patient flow analysis. At top-tier sites, coordinators review 3–6 months of EMR records (with consent) to identify eligible patients by ICD-10 codes. This reduces recruitment variability post-activation.
What Fails: Sole Reliance on IRB Approval Speed
Fast IRB approval fast FPI. A site in Hyderabad once cleared ethics in 14 days but took 92 days to enroll Patient 1 due to:
- Coordinators reassigned mid-feasibility
- No pre-screened patients
- Investigator on sabbatical
Lesson: IRB speed is only one pillar. It must be paired with activation readiness scoring.
What Works: Pre-Study Site Readiness Audits
At Oxygen Clinical Research and Services, we deploy a 3-part site readiness audit before initiation:
- Document readiness: DCGI submission pack, EC formats, delegation logs
- Staff competency: GCP training, protocol simulation
- Patient access verification: EMR search, referral network map
Sites passing all three start recruitment within 28 days of IRB approval a 68% improvement over non-audited sites.
What Fails: Ignoring Investigator Portfolio Overload
We once audited a “star” investigator with 12 active trials. Their site failed to randomize a single patient in a Phase 3 cardiovascular study. Root cause: coordinator team split across 4 studies, no dedicated time for patient follow-up.
Fix: Cap investigator trial load at 3 active protocols max, especially in high-monitoring-demand trials.
India-Specific Site Challenges: Hard Truths and Mitigation
India offers scale. But scale without structure leads to failure. Below are sector-wide issues and mitigation strategies executed in real trials.
Challenge 1: IRB/EC Variability and Delays
While Schedule Y mandates ethics review within 30 days, median approval time is 38 days, with rural centers taking up to 72 days due to infrequent meeting schedules.
| EC Type | Avg. Approval Time (Days) | Common Delays | Mitigation Strategy |
| Institutional EC (Urban) | 18–25 | ICF formatting, CVs | Pre-submission checklist, SMO liaison |
| Independent EC (Pan-India) | 28–40 | Investigator disclosures, insurance proof | Pre-filled templates, SMO legal support |
| Government Hospital EC | 45–72 | Bureaucratic review, meeting gaps | Dual-track submission, SMO follow-up calendar |
Source: CDSCO EC Portal Data (2022–2023), 1,382 submissions SMO Tip: Use EC-specific cover letters. Generic submissions get delayed.
Challenge 2: Patient Dropout Due to Logistics
In rural and semi-urban sites, 30–45% of screen failures are due to travel cost or accommodation issues not eligibility.
| Patient Factor | Impact on Dropout | SMO-Validated Solution |
| Distance >50 km | 38% higher dropout | Transport reimbursement, mobile visits |
| Lack of caregiver | 29% higher dropout | Site-based caregiver support network |
| Visit frequency | 22% non-compliance | Tele-visit integration for safety labs |
Source: Oxygen Clinical Research, Post-Trial Dropout Analysis (2021–2023), 12 studies
Challenge 3: Source Data Gaps
SMO monitoring reveals that 41% of source documentation errors occur at screening due to overloaded coordinators or EMR access issues.
| Error Type | Frequency (%) | Root Cause | Prevention |
| Missing lab dates | 32% | Manual entry, paper-based tracking | EMR integration, SMO data validation |
| Unclear eligibility rationale | 27% | Rushed screening | Pre-screening checklist |
| Consent not signed | 19% | Patient leaves before signing | Consent station, dedicated staff |
Source: Internal audit, Oxygen Clinical Research (n = 89 sites, 2022)
12-Point Feasibility Checklist: Practical Sponsor Guide
Use this checklist during site selection. Each item must be validated—not assumed.
1. Historical Enrollment Credibility
- Verify actual enrollment in last 3 trials vs. target
- Check for patterns of over-promising
- Use CTRI (ctri.nic.in) to validate recruitment claims
2. IRB/EC Engagement Efficiency
- Confirm EC type and meeting frequency
- Review past approval timelines for the same site
- Require SMO to submit pre-feasibility EC package
3. Patient Access Model
- Demand pre-screened patient list with ICD-10 codes
- Validate with SMO-led EMR access (with privacy compliance)
- Require site to provide monthly recruitment forecast
4. Site Staff Stability
- Review coordinator CVs and tenure
- Confirm backup coordinator assignment
- Require GCP training certificates (ICMR/CDSCO-approved)
5. SMO Integration Level
- Confirm on-site SMO presence (FTE or shared)
- Review SOP adherence for screening and randomization
- Require proof of protocol-specific training
6. Source Document Completeness
- Conduct pre-start source data audit (10 past charts)
- Verify EMR access and data export capability
- Require site to assign source data custodian
7. Protocol Compliance Risk
- Review monitoring reports from last 2 trials
- Flag sites with >1 major protocol deviation
- Use SMO to simulate high-risk visits (e.g., dosing, AE reporting)
8. Lab & Diagnostic Readiness
- Confirm on-site labs or central lab courier linkage
- Validate lab accreditation (NABL preferred)
- Require lab SOPs for sample handling
9. Regulatory Documentation Status
- Confirm Investigator’s Brochure, CV, GCP, financial disclosure ready
- Use standardized submission template (aligned with Schedule Y)
- Require SMO to track document version control for Investigator Site Selection Clinicaltrials.
10. Financial & Contract Readiness
- Use pre-approved budget template (INR/USD)
- Confirm hospital finance office turnaround time
- Require SMO legal to manage negotiation
11. Investigator Time Commitment
- Require time log for last 30 days
- Limit active trials to ≤3
- Confirm weekly availability for patient review
12. Geopolitical & Site Access Risk
- Map site location against flood zones, transport routes for Investigator Site Selection Clinicaltrials.
- Verify backup power and internet for Investigator Site Selection Clinicaltrials.
- Require site to provide emergency contact plan for Investigator Site Selection Clinicaltrials.
Comparative Site Performance: SMO-Managed vs. Non-SMO Sites (India, 2022–2023)
| KPI | SMO-Managed Sites (n = 68) | Non-SMO Sites (n = 52) | Delta |
| Median Days from IRB Approval to FPI | 24 | 63 | -39 days |
| % Sites Enrolling ≥80% of target | 82% | 48% | +34 pts |
| Protocol Deviations per 100 CRFs | 1.8 | 4.6 | -61% |
| Source Data Query Rate (per 100 CRFs) | 6.2 | 14.7 | -58% |
| Site Initiation Visit (SIV) Readiness Score (0–100) | 89 | 61 | +28 pts |
| Investigator Retention (12-month period) | 88% | 64% | +24 pts |
Source: Internal benchmarking, Oxygen Clinical Research and Services, 2023. Audits conducted across 5 therapeutic areas (oncology, diabetes, CVD, respiratory, rare disease)
Note: SMO-managed sites had full-time SMO coordinators, pre-feasibility audits, and continuous monitoring support.
SMO Selection: What Sponsors Should Evaluate
Not all SMOs are equal. Use this table to assess SMO capability not just cost.
| Evaluation Criterion | High-Performing SMO | Low-Performing SMO | Validation Method |
| Site Audit Frequency | Quarterly pre-activation audits | Annual audits only | Request audit report samples |
| Staff Training Model | Protocol-specific simulations, GCP refreshers | One-time onboarding | Review training calendar |
| EC Liaison Capability | Dedicated EC submission team | Coordinators handle submissions | Ask for EC approval timelines |
| Data Quality Focus | Source data validation, query trend analysis | Reactive query resolution | Request SDV tracking report |
| Technology Use | EDC integration, eSource readiness | Paper-based only | Demo system access |
| Investigator Relationship | Regular follow-up, risk scoring | Transactional communication | Interview site staff |
| Regulatory Compliance | 100% CDSCO/DLW audit pass rate | Past findings in audits | Request audit history |
Source: Sponsor-conducted SMO assessments (2020–2023)
Key Success Drivers:
- SMO-led EMR pre-screening reduced screen failure rate by 44%
- Pre-feasibility budget templates cut contract time by 50%
- On-site SMO coordinators reduced missed visits by 37%
“We used to blame sites. Now we blame our feasibility process. This trial changed how we pick sites.”
Clinical Study Manager, Pharma for Investigator Site Selection Clinicaltrials.
Why Oxygen Clinical Research and Services Delivers Differentiated Outcomes
Having worked with multiple SMOs across India, I can state with confidence: execution excellence is not accidental it’s engineered.
Oxygen Clinical Research and Services operates on three principles that align with sponsor ROI:
1. Predictability through Data
- Pre-feasibility patient pool analysis using anonymized EMR data
- Site scoring model with real-time KPI tracking
- IRB timeline forecasting based on historical EC performance
2. Compliance Built In, Not Audited In
- SOPs aligned with Schedule Y, ICMR, and FDA 21 CFR Part 11
- Source data custodians assigned at each site
- Monthly GCP refreshers for site staff
3. Patient-Centric Access Design
- Transport reimbursement tracking
- Weekend and holiday visit scheduling
- Mobile phlebotomy for safety labs
We don’t promise “fast recruitment.” We deliver sustainable, compliant enrollment with audit trails to prove it. This isn’t marketing. It’s how we’ve delivered 94% of sites within 10% of enrollment forecast over the last 3 years for Investigator Site Selection Clinicaltrials.
Strategic Conclusion: Site Selection Is an Operational Discipline, Not a Checklist
If your clinical trial fails in India, it likely failed at the feasibility stage—not because patients weren’t available, but because the site wasn’t ready. The 12-point checklist above is not theoretical. It’s battle-tested across oncology, metabolic disease, and rare indications. It prioritizes executional signals—staff tenure, source data quality, EC behavior—over charisma or hospital brand. And it leverages SMOs not as manpower providers, but as operational integrity layers that de-risk the entire trial lifecycle. India’s potential in global clinical development is no longer in question.
Are sponsors selecting sites based on data, or hope?
Top sponsors have moved from asking, “Can this site do the trial?” to “Is this site ready to do the trial?” That shift from aspiration to readiness is what separates on-time FPI from perpetual delay.
Use the checklist. Validate every claim. Partner with SMOs that operate like clinical operations extensions not staffing agencies for Investigator Site Selection Clinicaltrials.
Your next trial’s success starts not with protocol approval, but with the first site feasibility call.
Suggested Visuals for This Blog
- Infographic: The 12-Point Site Feasibility Checklist Visual flowchart with icons for each point.
- Bar Chart: SMO vs. Non-SMO Site Performance Comparing FPI time, enrollment rate, and query rate.
- Map of India: High-Performing Trial Sites by Region Highlighting clusters in Pune, Chennai, Ahmedabad, and Delhi NCR.
- Timeline Diagram: From Feasibility to FPI Showing lag points and SMO intervention zones.
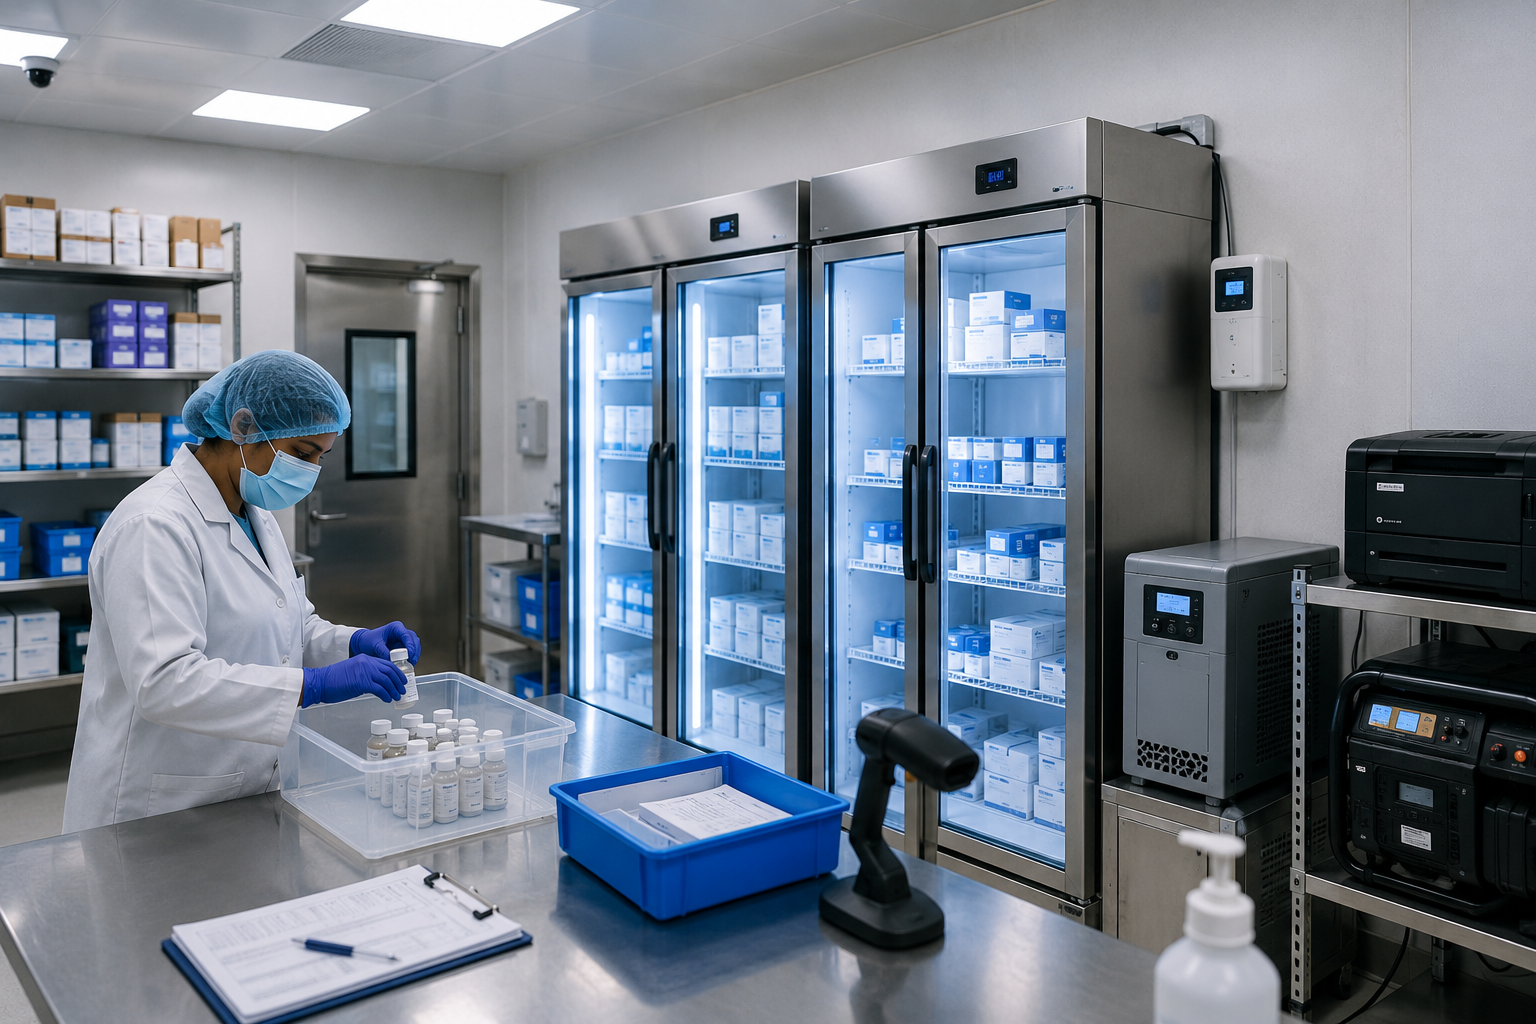
- Photo: A clinical coordinator reviewing source data with a tablet at a site showcasing real-world execution.
Authoritative References
- Central Drugs Standard Control Organization (CDSCO): https://cdsco.gov.in
- Schedule Y (Drugs & Cosmetics Rules, 1945) – Clinical Trial Regulations
- Indian Council of Medical Research (ICMR) – Ethical Guidelines for Biomedical Research
- Clinical Trials Registry – India (CTRI): https://ctri.nic.in
- World Health Organization (WHO) – Handbook for Good Clinical Research Practice
- U.S. FDA – 21 CFR Part 11 (Electronic Records)
- New Drugs and Clinical Trials Rules, 2019 – Gazette of India
- https://oxygenclinicaltrial.com/latest-updates-clinical-trials